
Page 77 - Applied Probability
P. 77
4. Hypothesis Testing and Categorical Data
60
Example 4.2.1 ABO Ulcer Data
Consider the ABO duodenal ulcer data presented earlier and repeated in
column 2 of Table 4.1. If we do not assume Hardy-Weinberg equilibrium,
then each of the four phenotypes A, B, AB, and O is assigned a correspond-
ing frequency q A , q B , q AB , and q O , with no implied functional relationship
among them except for q A + q B + q AB + q O = 1. The maximum likeli-
hood estimates of these phenotypic frequencies are the sample proportions
ˆ q A = n A = 186 ,ˆ q B = n B = 38 ,ˆ q AB = n AB = 13 , and ˆ q O = n O = 284 .
n 521 n 521 n 521 n 521
Under Hardy-Weinberg equilibrium, gene counting provides the maximum
likelihood estimates ˆ p A = .2136, ˆ p B = .0501, and ˆ p O = .7363. Denote the
vector of maximum likelihood estimates for the two hypotheses by ˆ q and
ˆ p, respectively, and the corresponding maximum likelihoods by L(ˆ q) and
L(ˆ p). The likelihood ratio test involves the statistic
ˆ q
ˆ q
ˆ q
L(ˆ q) ˆ q n A n B n AB n O
A
AB
O
B
2ln =2 ln
2
2
L(ˆ p) (ˆ p +2ˆ p A ˆ p O ) n A (ˆ p +2ˆ p B ˆ p O ) n B (2ˆ p A ˆ p B ) n AB (ˆ p )
2 n O
A B O
ˆ q A ˆ q B
=2n A ln 2 +2n B ln 2
ˆ p +2ˆ p A ˆ p O ˆ p +2ˆ p B ˆ p O
B
A
ˆ q AB ˆ q O
+2n AB ln +2n O ln 2
2ˆ p A ˆ p B ˆ p
O
=2 (1.578 − 1.625 − 1.740 + 1.983)
= .393.
2
This statistic is approximately distributed as a χ distribution with de-
grees of freedom equaling the difference in the number of independent para-
meters between the full hypothesis and the Hardy-Weinberg subhypothesis.
In this case the degrees of freedom are 3 − 2 = 1. The likelihood ratio is
2
not significant at the .05 level based on comparison with a χ distribution.
1
Thus, we provisionally accept Hardy-Weinberg equilibrium in this popula-
tion of ulcer patients.
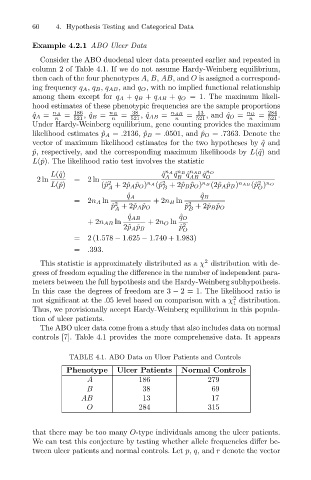
The ABO ulcer data come from a study that also includes data on normal
controls [7]. Table 4.1 provides the more comprehensive data. It appears
TABLE 4.1. ABO Data on Ulcer Patients and Controls
Phenotype Ulcer Patients Normal Controls
A 186 279
B 38 69
AB 13 17
O 284 315
that there may be too many O-type individuals among the ulcer patients.
We can test this conjecture by testing whether allele frequencies differ be-
tween ulcer patients and normal controls. Let p, q, and r denote the vector