
Page 94 - Applied Process Design For Chemical And Petrochemical Plants Volume II
P. 94
Distillation 83
where B = bottoms flowrate, mol/h Distillation
c = number of components
D = distillate flowrate, mol/h
2.0
F = flowrate of feed, mol/h 1.0 2.2 2.4 2.6 2.8 3.0 3.0 3.4 3.6
Fj = flowrate of feed j, mol/h
FFR = factor for contribution of other feed flow to mini-
mum reflux 0.9
Fmj = factor for contribution of feed j flow to minimum
reflux 0.0
FSR = factor for contribution of sidestream flow to mini-
mum reflux 0.7
FSR,k = factor for contribution of sidestream k flow to
minimum reflux
HK = heavy key component
L = liquid flowate, mol/h
LK = light key component 0.5
nf = number of feeds
ns = number of sidestreams 0.4
m = number of sidestreams above feed n
qF = thermd condition of feed 0.3
qs = thermal condition of sidestream
R = reflux ratio 0.2
RF = feed component of minimum reflux
RF,, = feed component of minimum reflux for feed n
ROF r- other-feeds component of minimum reflux 0. I
Rmin = minimum reflux ratio
RS = sidestream component of minimum reflux ‘1.0 1.2 1.4 1.6 1.8 2.0 2.2 2.4 2.6
S = flowrate of sidestream, mol/h
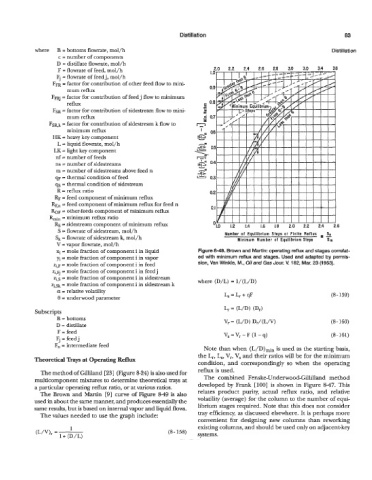
sk = flowrate of sidestream k, mol/h Number of Equilibrium Steps at Finite Reflux S,
Minimum Number of Equilibrium Steps
Sm
V = vapor flowrate, mol/h
xi = mole fraction of component i in liquid Figure 8-49. Brown and Martin: operating reflux and stages correlat-
yi =i mole fraction of component i in vapor ed with minimum reflux and stages. Used and adapted by permis-
Z~,F =: mole fraction of component i in feed sion, Van Winkle, M., Oil and Gas Jour. V. 182, Mar. 23 (1953).
zi,q =i mole fraction of component i in feed j
q,s =i mole fraction of component i in sidestream
Zi,Sk =i mole fraction of component i in sidestream k where (D/L) = l/(L/D)
a =: relative volatility
0 =i underwood parameter L, = Lr + qF (8-139)
Subscripts
B = bottoms
D = distillate
F = feed
Fj = feed j Vs=V,-F(l-q) (8- 161)
F, = intermediate feed
Note than when (L/D)min is used as the starting basis,
the L,, L,, V,, V, and their ratios will be for the minimum
Theoretical Trays at Operating Reflux
condition, and correspondingly so when the operating
The meth.od of GilliIand [23] (Figure 8-24) is also used for reflux is used.
multicomponent mixtures to determine theoretical trays at The combined Fenske-Underwood-Gillilland method
a particular operating reflux ratio, or at various ratios. developed by Frank [loo] is shown in Figure 8-47. This
The Brown and Martin [9] curve of Figure 8-49 is also relates product purity, actual reflux ratio, and relative
used in about the same manner, and produces essentially the volatility (average) for the column to the number of equi-
same results, but is based on internal vapor and liquid flows. librium stages required. Note that this does not consider
The values needed to use the graph include: tray efficiency, as discussed elsewhere. It is perhaps more
convenient for designing new columns than reworking
1 existing columns, and should be used only on adjacent-key
(L’v)r = 1 + (D/L) (8- 158) systems.