
Page 98 - Applied Process Design For Chemical And Petrochemical Plants Volume II
P. 98
Distillation 87
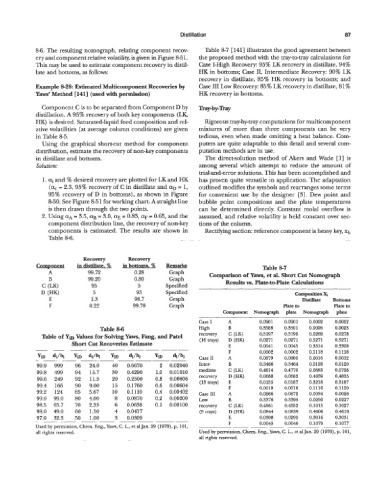
8-6. The resulting nomograph, relating component recov- Table 87 [ 1411 illustrates the good agreement between
ery and component relative volatility, is given in Figure 8-51. the proposed method with the tray-to-tray calculations for
This may be used to estimate component recovery in distil- Case I-High Recovery: 95% LK recovery in distillate, 94%
late and bottoms, as follows: HK in bottoms; Case 11, Intermediate Recovery: 90% LK
recovery in distillate, 85% HK recovery in bottoms; and
Example 8-28: Estimated Multicomponent Recoveries by Case I11 Low Recovery: 85% LK recovery in distillate, 81 %
Yaws’ Method [141] (used with perdon) HK recovery in bottoms.
Component C is to be separated from Component D by Tray-b y-Tray
distillation. A 95% recovery of both key components (LK,
HK) is desired. Saturated-liquid feed composition and rel- Rigorous tray-by-tray computations for multicomponent
ative volatilities (at average column conditions) are given mixtures of more than three components can be very
in Table 8-5. tedious, even when made omitting a heat balance. Com-
Using the graphical short-cut method for component puters are quite adaptable to this detail and several com-
distribution, estimate the recovery of non-key components putation methods are in use.
in distillate and bottoms. The direct-solution method of Akers and Wade [l] is
Solution: among several which attempt to reduce the amount of
trial-and-error solutions. This has been accomplished and
ai and % desired recovery are plotted for LK and HK has proven quite versatile in application. The adaptation
(ac = 2.3, 95% recovery of C in distillate and aD = I, outlined modifies the symbols and rearranges some terms
95% recovery of D in bottoms), as shown in Figure for convenient use by the designer [3]. Dew point and
8-50. See Figure 8-51 for working chart. A straight line bubble point compositions and the plate temperatures
is then drawn through the two points. can be determined directly. Constant molal overflow is
Usinga~=3.5,ag=3.0,a~=0.83,aF=0.65,andthe
assumed, and relative volatility is held constant over sec-
component distribution line, the recovery of non-key tions of the column.
components is estimated. The results are shown in Rectifjnng section: reference component is heavy key, xh
Table 8-6.
Recovery Recovery
ComDonent in distillate, % in bottoms. % Remarks Table 87
A 99.72 0.28 Graph Comparison of Yaws, et al. Short Cut Nomograph
B 99.20 0.80 Graph
c (W 95 5 Specified Results vs. Plate-to-Plate Calculations
D (HK) 5 95 Specified Composition Xj
E 1.3 98.7 Graph Distillate Bottoms
F 0.22 99.78 Graph Plate to Plate to
Component Nomograph plate Nomograph plate
Case I A 0.0901 0.0901 0.0002 0.0002
Table 8-6 High B 0.3588 0.3391 0.0026 0.0023
0.3190
0.0269
0.0278
Table of Ya Values for Solving Yaws, Fang, and Pate1 recovery (LK) 0.5197 0.0271 0.5271 0.5271
0.0271
Short Cut Recoveries Estimate (16trays) D(HK) 0.0041 0.0045 0.3314 0.3308
E
~. -
~ 0.0002 0.0002 0.1118 0.1118
YiD di/bi YiD &/bi &/bi Ya &/bi Case I1 0.0879 0.0880 0.0016 0.0012
-. -_ - _-
99.9 999 96 24.0 0.6670 2 0.02040 Inter- 0.3466 0.3464 0.0128 0.0120
99.8 499 94 13.7 0.4290 1.0 0.01010 mediate 0.4814 0.4770 0.0683 0.0726
99.6 249 92 11.5 0.2500 0.8 0.00806 recovery 0.0668 0.0682 0.4839 0.4833
0.318’7
0.0153
0.3218
0.0187
99.4 166 90 9.00 0.1760 0.6 0.00604 (13 trays) 0.0018 0.0018 0.1116 0.1120
99.2 124 85 5.67 0.1110 0.4 0.00402 Case I11 0.0866 0.0872 0.0034 0.0028
99.0 99.0 80 4.00 0.0870 0.2 0.00200 ~~ Low 0.3376 0.3395 0.0250 0.0227
98.5 65.7 70 2.33 6 0.0638 0.1 0.00~00 recovery C (LK) 0.4561 0.4552 0.1015 0.1027
98.0 49.0 60 1.50 4 0.0417 (9trays) D(HK) 0.0844 0.0839 0.4606 0.4610
97.0 32.3 50 1.00 3 0.0309 E 0.0308 G.0295 0.3016 0.3031
.. . . .- -- . -- .- - F 0.0045 0.0046 0.1079 0.1077
Used by permission, Chem. Eng.,Yaw, C. L., et al Jan. 29 (1979), p. 101, -. ~ ~. .. -. .-
all rights reserved. Used by permission, Chem. Eng., Yaws, C. L., et a1 Jan. 29 (1979), p. 101,
all rights reserved.