
Page 105 - Applied Process Design for Chemical and Petrochemical Plants Volume I
P. 105
92 Applied Process Design for Chemical and Petrochemical Plants
9 Q
Index 1
f
.05
Y
/
0
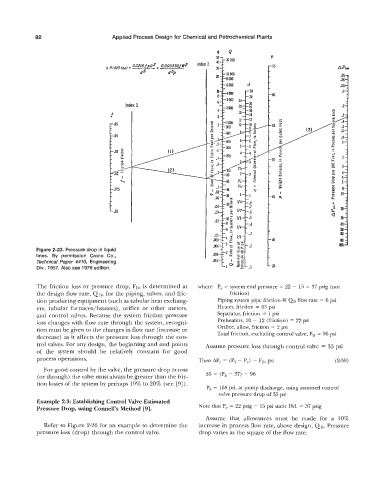
Figure 2-23. Pressure drop in liquid
lines. By permission Crane Co.,
Technical Paper #470, Engineering
Div., 1957. Also see 1976 edition.
The friction loss or pressure drop, FD, is determined at where P, = system end pressure = 22 + 15 = 37 psig (not
the design flow rate, QD, for the piping, valves, and fric- friction)
tion producing equipment (such as tubular heat exchang- Piping system pipe friction @ QD flow rate = 6 psi
ers, tubular furnaces/heaters) , orifice or other meters, Heater, friction = 65 psi
and control valves. Because the system friction pressure Separator, friction = 1 psi
loss changes with flow rate through the system, recogni- Preheaters, 10 + 12 (friction) = 22 psi
tion must be given to the changes in flow rate (increase or Orifice, allow, friction = 2 psi
Total friction, excluding control valve, FD = 96 psi
decrease) as it affects the pressure loss through the con-
trol valves. For any design, the beginning and end points Assume pressure loss through control valve = 35 psi
of the system should be relatively constant for good
process operations. Then APc = (Ps - P,) - FD, psi (2-59)
For good control by the valve, the pressure drop across
(or through) the valve must always be greater than the fric- 35 = (Ps - 37) - 96
tion losses of the system by perhaps 10% to 20% (see [9]).
Ps = 168 psi, at pump discharge, using assumed control
valve pressure drop of 35 psi
Example 2-3: Establishing Control Valve Estimated
Pressure Drop, using Cormell's Method [9]. Note that P, = 22 psig + 15 psi static Hd. = 37 psig
Assume that allowances must be made for a 10%
Refer to Figure 2-26 for an example to determine the increase in process flow rate, above design, QD. Pressure
pressure loss (drop) through the control valve. drop varies as the square of the flow rate.