
Page 207 - Applied Process Design for Chemical and Petrochemical Plants Volume I
P. 207
u.0. 6cIo
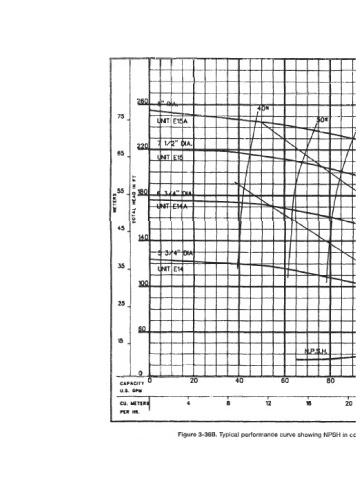
Figure 3-368. Typical performance curve showing NPSH in convenient form. (By permission, Crane Co., Deming Pump Div.)