Page 208 - Applied Process Design for Chemical and Petrochemical Plants Volume I
P. 208

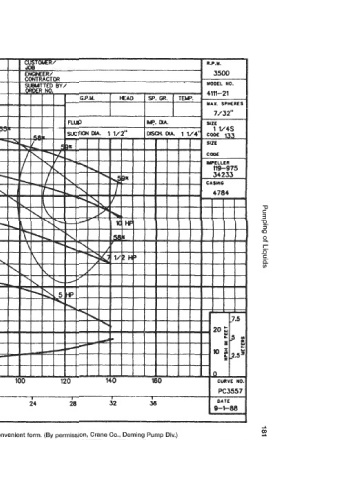
u.0. 6cIo


 Figure 3-368. Typical performance curve showing NPSH in convenient form. (By permission, Crane Co., Deming Pump Div.)
   203   204   205   206   207   208   209   210   211   212   213