
Page 53 - Applied Process Design for Chemical and Petrochemical Plants Volume I
P. 53
13rocess Planning, Scheduling and Flowsheet Design 41
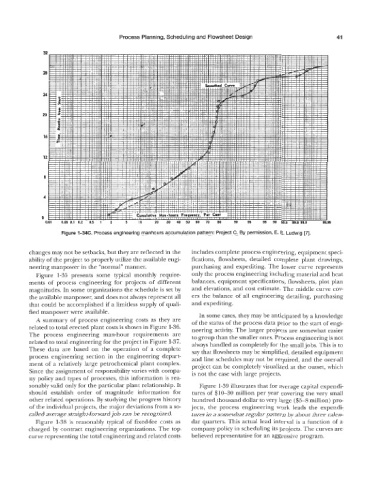
Figure 1 -34C. Process engineering manhours accumulation pattern: Project C. By permission, E. E. Ludwig [7].
changes may not be setbacks, but they are reflected in the includes complete process engineering, equipment speci-
ability of the projecl.. to properly utilize the available engi- fications, flowsheets, detailed complete plant drawings,
neering manpower in the “normal” manner. purchasing and expediting. The lower curve represents
Figure 1-35 presents some typical monthly require- only the process engineering including material and heat
ments of process engineering for projects of different balances, equipment specifications, flowsheets, plot plan
magnitudes. In some organizations the schedule is set by and elevations, and cost estimate. The middle curve cov-
the available manpower, and does not always represent all ers the balance of all engineering detailing, purchasing
that could be accomplished if a limitless supply of quali- and expediting.
fied manpower were available. In some cases, they may be anticipated by a knowledge
A summary of process engineering costs as they are of the status of the process data prior to the start of engi-
related to total erected plant costs is shown in Figure 1-36. neering activity. The larger projects are somewhat easier
The process engineering man-hour requirements are to group than the smaller ones. Process engineering is not
related to total engineering for the project in Figure 1-37. always handled as completely for the small jobs. This is to
These data are based on the operation of a complete say that flowsheets may be simplified, detailed equipment
process engineering section in the engineering depart- and line schedules may not be required, and the over-all
ment of a relatively large petrochemical plant complex. project can be completely visualized at the outset, which
Since the assignment of responsibility varies with compa- is not the case with large projects.
ny policy and types of processes, this information is rea-
sonably valid only for the particular plant relationship. It Figure 1-39 illustrates that for average capital expendi-
should establish order of magnitude information for tures of $10-30 million per year covering the very small
other related operations. By studying the progress history hundred thousand dollar to very large ($5-8 million) pro-
of the individual projects, the major deviations from a so- jects, the process engineering work leads the expendi-
called average straight-forward job can be recognized. tures in a somewhat regular pattern by about three calen-
Figure 1-38 is reasonably typical of fixed-fee costs as dar quarters. This actual lead interval is a function of a
charged by contract engineering organizations. The top company policy in scheduling its projects. The curves are
curve representing the total engineering and related costs believed representative for an aggressive program.