
Page 62 - Applied Statistics And Probability For Engineers
P. 62
c02.qxd 5/10/02 1:07 PM Page 45 RK UL 6 RK UL 6:Desktop Folder:TEMP WORK:MONTGOMERY:REVISES UPLO D CH114 FIN L:Quark Files:
2-5 MULTIPLICATION AND TOTAL PROBABILITY RULES 45
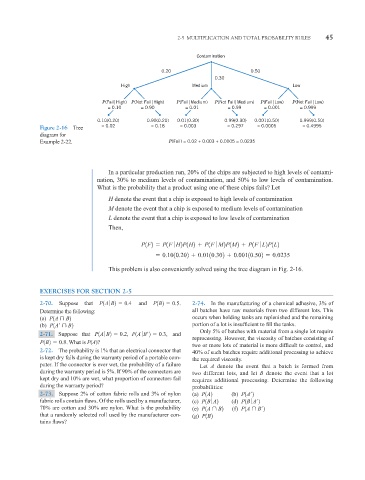
Contamination
0.20 0.50
0.30
High Medium Low
P(FailHigh) P(Not FailHigh) P(FailMedium) P(Not FailMedium) P(FailLow) P(Not FailLow)
= 0.10 = 0.90 = 0.01 = 0.99 = 0.001 = 0.999
0.10(0.20) 0.90(0.20) 0.01(0.30) 0.99(0.30) 0.001(0.50) 0.999(0.50)
= 0.02 = 0.18 = 0.003 = 0.297 = 0.0005 = 0.4995
Figure 2-16 Tree
diagram for
Example 2-22. P(Fail) = 0.02 + 0.003 + 0.0005 = 0.0235
In a particular production run, 20% of the chips are subjected to high levels of contami-
nation, 30% to medium levels of contamination, and 50% to low levels of contamination.
What is the probability that a product using one of these chips fails? Let
H denote the event that a chip is exposed to high levels of contamination
M denote the event that a chip is exposed to medium levels of contamination
L denote the event that a chip is exposed to low levels of contamination
Then,
P1F2 P1F ƒ H2P1H2 P1F ƒ M2P1M2 P1F ƒ L2P1L2
0.1010.202 0.0110.302 0.00110.502 0.0235
This problem is also conveniently solved using the tree diagram in Fig. 2-16.
EXERCISES FOR SECTION 2-5
2-70. Suppose that P1A ƒ B2 0.4 and P1B2 0.5. 2-74. In the manufacturing of a chemical adhesive, 3% of
Determine the following: all batches have raw materials from two different lots. This
(a) P1A ¨ B2 occurs when holding tanks are replenished and the remaining
(b) P1A¿¨ B2 portion of a lot is insufficient to fill the tanks.
Only 5% of batches with material from a single lot require
2-71. Suppose that P1A ƒ B2 0.2, P1A ƒ B¿2 0.3, and
reprocessing. However, the viscosity of batches consisting of
P1B2 0.8. What is P(A)?
two or more lots of material is more difficult to control, and
2-72. The probability is 1% that an electrical connector that 40% of such batches require additional processing to achieve
is kept dry fails during the warranty period of a portable com- the required viscosity.
puter. If the connector is ever wet, the probability of a failure Let A denote the event that a batch is formed from
during the warranty period is 5%. If 90% of the connectors are two different lots, and let B denote the event that a lot
kept dry and 10% are wet, what proportion of connectors fail requires additional processing. Determine the following
during the warranty period? probabilities:
2-73. Suppose 2% of cotton fabric rolls and 3% of nylon (a) P1A2 (b) P1A¿2
fabric rolls contain flaws. Of the rolls used by a manufacturer, (c) P1B ƒ A2 (d) P1B ƒ A¿2
70% are cotton and 30% are nylon. What is the probability (e) P1A ¨ B2 (f) P1A ¨ B¿2
that a randomly selected roll used by the manufacturer con- (g) P1B2
tains flaws?