
Page 331 - Applied statistics and probability for engineers
P. 331
Section 9-1/Hypothesis Testing 309
Thus, in testing any statistical hypothesis, four different situations determine whether the i nal
decision is correct or in error. These situations are presented in Table 9-1.
Because our decision is based on random variables, probabilities can be associated with
the type I and type II errors in Table 9-1. The probability of making a type I error is denoted
by the Greek letter α.
Probability of
Type I Error a = (type I error ) = (reject H when H is true ) (9-3)
P
P
0
0
Sometimes the type I error probability is called the signii cance level, the `-error, or the
size of the test. In the propellant burning rate example, a type I error will occur when either
x > 51 5 or x < 48 5 when the true mean burning rate really is μ = 50 centimeters per second.
.
.
Suppose that the standard deviation of burning rate is σ = 2 5 centimeters per second and
.
that the burning rate has a distribution for which the conditions of the central limit theorem
apply, so the distribution of the sample mean is approximately normal with mean μ = 50 and
standard deviation σ n = .5 10 = .79. The probability of making a type I error (or the
2
0
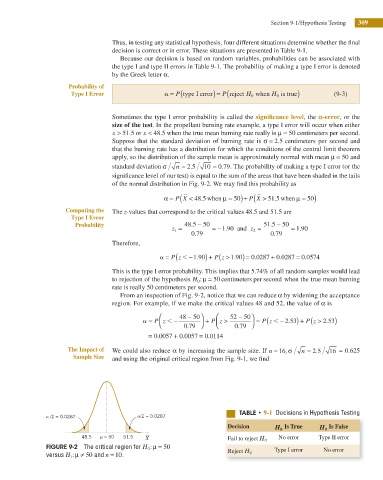
signiicance level of our test) is equal to the sum of the areas that have been shaded in the tails
of the normal distribution in Fig. 9-2. We may ind this probability as
P
P
.5
.5
α = (X < 48 when μ = ) + (X > 51 when μ = )
50
50
Computing the The z-values that correspond to the critical values 48.5 and 51.5 are
Type I Error
.
Probability 48 5 − 50 51 5 − 50
.
z 1 = = − 1 90 and z 2 = = 1 90
.
.
0 79 0 79
.
.
Therefore,
>
P
P
a = (z , −1 90 ) + (z 1 90. ) = 0 0287. + 0 0287 = 0 0574
.
.
.
This is the type I error probability. This implies that 5.74% of all random samples would lead
to rejection of the hypothesis H 0 : = 50 centimeters per second when the true mean burning
μ
rate is really 50 centimeters per second.
From an inspection of Fig. 9-2, notice that we can reduce α by widening the acceptance
region. For example, if we make the critical values 48 and 52, the value of α is
⎛ 48 − 50 ⎞ ⎛ 52 − 50 ⎞ > 2 5. 33)
P
⎜
⎜
a = P z , − 0 79 ⎟ ⎠ + P z > 0 79 ⎟ ⎠ = (z , −2 53. ) + P z (
⎝
⎝
.
.
= 0 0057 +. 0 0057 =. 0 0114
.
The Impact of We could also reduce α by increasing the sample size. If n = 16 , σ n = .5 16 = 0.625
2
Sample Size and using the original critical region from Fig. 9-1, we i nd
5"#-& t 9-1 Decisions in Hypothesis Testing
a /2 = 0.0287 a/2 = 0.0287
Decision H 0 Is True H 0 Is False
48.5 m = 50 51.5 X Fail to reject H 0 No error Type II error
FIGURE 9-2 The critical region for H 0 :μ = 50 Type I error No error
versus H 1 :μ ≠ 50 and n = 10. Reject H 0