
Page 334 - Applied statistics and probability for engineers
P. 334
312 Chapter 9/Tests of Hypotheses for a Single Sample
0.8
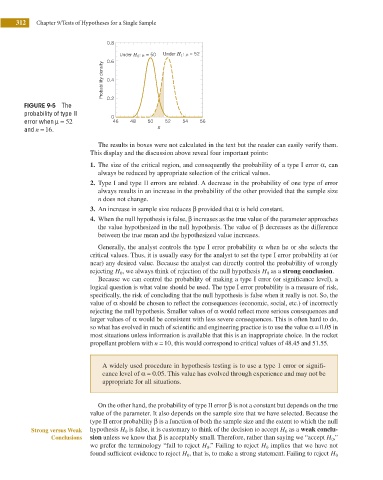
Under H 0 : m = 50 Under H 1 : m = 52
0.6
Probability density 0.4
FIGURE 9-5 The 0.2
probability of type II 0
error when μ = 52 46 48 50 52 54 56
and n = 16. – x
The results in boxes were not calculated in the text but the reader can easily verify them.
This display and the discussion above reveal four important points:
1. The size of the critical region, and consequently the probability of a type I error α, can
always be reduced by appropriate selection of the critical values.
2. Type I and type II errors are related. A decrease in the probability of one type of error
always results in an increase in the probability of the other provided that the sample size
n does not change.
3. An increase in sample size reduces β provided that α is held constant.
4. When the null hypothesis is false, β increases as the true value of the parameter approaches
the value hypothesized in the null hypothesis. The value of β decreases as the difference
between the true mean and the hypothesized value increases.
Generally, the analyst controls the type I error probability α when he or she selects the
critical values. Thus, it is usually easy for the analyst to set the type I error probability at (or
near) any desired value. Because the analyst can directly control the probability of wrongly
rejecting H 0 , we always think of rejection of the null hypothesis H 0 as a strong conclusion.
Because we can control the probability of making a type I error (or signiicance level), a
logical question is what value should be used. The type I error probability is a measure of risk,
speciically, the risk of concluding that the null hypothesis is false when it really is not. So, the
value of α should be chosen to relect the consequences (economic, social, etc.) of incorrectly
rejecting the null hypothesis. Smaller values of α would relect more serious consequences and
larger values of α would be consistent with less severe consequences. This is often hard to do,
so what has evolved in much of scientiic and engineering practice is to use the value α = 0.05 in
most situations unless information is available that this is an inappropriate choice. In the rocket
propellant problem with n = 10, this would correspond to critical values of 48.45 and 51.55.
A widely used procedure in hypothesis testing is to use a type 1 error or signii-
cance level of α = 0.05. This value has evolved through experience and may not be
appropriate for all situations.
On the other hand, the probability of type II error β is not a constant but depends on the true
value of the parameter. It also depends on the sample size that we have selected. Because the
type II error probability β is a function of both the sample size and the extent to which the null
Strong versus Weak hypothesis H 0 is false, it is customary to think of the decision to accept H 0 as a weak conclu-
Conclusions sion unless we know that β is acceptably small. Therefore, rather than saying we “accept H 0 ,”
we prefer the terminology “fail to reject H 0 .” Failing to reject H 0 implies that we have not
found suficient evidence to reject H 0 , that is, to make a strong statement. Failing to reject H 0