
Page 44 - Applied statistics and probability for engineers
P. 44
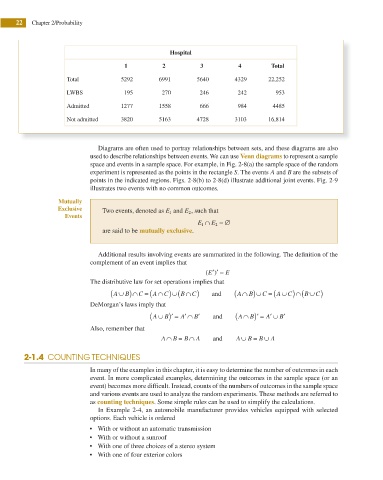
22   Chapter 2/Probability


                                                           Hospital

                                             1          2           3          4         Total
                            Total           5292       6991        5640       4329      22,252

                            LWBS             195        270         246        242        953

                            Admitted        1277       1558         666        984       4485
                            Not admitted    3820       5163        4728       3103      16,814


                                     Diagrams are often used to portray relationships between sets, and these diagrams are also
                                   used to describe relationships between events. We can use Venn diagrams to represent a sample
                                   space and events in a sample space. For example, in Fig. 2-8(a) the sample space of the random
                                   experiment is represented as the points in the rectangle S. The events A and B are the subsets of
                                   points in the indicated regions. Figs. 2-8(b) to 2-8(d) illustrate additional joint events. Fig. 2-9
                                   illustrates two events with no common outcomes.
                         Mutually
                         Exclusive    Two events, denoted as E 1  and E 2 , such that
                           Events
                                                                   E 1 ∩ E 2 = ∅
                                      are said to be mutually exclusive.


                                     Additional results involving events are summarized in the following. The deinition of the

                                   complement of an event implies that
                                                                      E
                                                                     ( ′ ′ = E
                                                                        )
                                   The distributive law for set operations implies that
                                         ( A∪ B)∩ C = ( A∩ C)∪( B ∩ C)  and   ( A∩ B)∪ C = ( A∪ C)∩( B ∪ C)
                                   DeMorgan’s laws imply that
                                                     ( A∪ B)′ =  A′ ∩ B′  and  ( A∩ B)′ =  A′ ∪ B′

                                   Also, remember that
                                                        A∩ B =  B ∩  A  and   A∪  B = B ∪  A

               2-1.4  COUNTING TECHNIQUES

                                   In many of the examples in this chapter, it is easy to determine the number of outcomes in each
                                   event. In more complicated examples, determining the outcomes in the sample space (or an
                                   event) becomes more dificult. Instead, counts of the numbers of outcomes in the sample space

                                   and various events are used to analyze the random experiments. These methods are referred to
                                   as counting techniques. Some simple rules can be used to simplify the calculations.
                                     In Example 2-4, an automobile manufacturer provides vehicles equipped with selected
                                   options. Each vehicle is ordered
                                   r  With or without an automatic transmission
                                   r  With or without a sunroof
                                   r  With one of three choices of a stereo system
                                   r  With one of four exterior colors