
Page 49 - Applied statistics and probability for engineers
P. 49
Section 2-1/Sample Spaces and Events 27
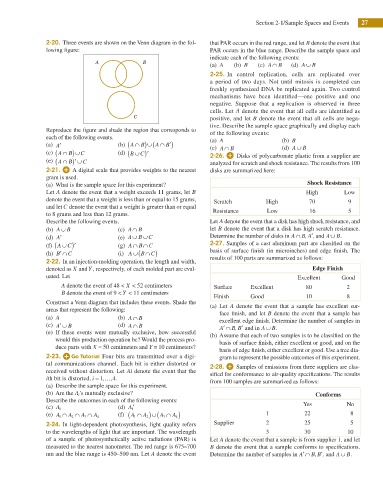
2-20. Three events are shown on the Venn diagram in the fol- that PAR occurs in the red range, and let B denote the event that
lowing igure: PAR occurs in the blue range. Describe the sample space and
indicate each of the following events:
A B
(a) A (b) B (c) A∩ B (d) A∪ B
2-25. In control replication, cells are replicated over
a period of two days. Not until mitosis is completed can
freshly synthesized DNA be replicated again. Two control
mechanisms have been identiied—one positive and one
negative. Suppose that a replication is observed in three
cells. Let A denote the event that all cells are identiied as
C positive, and let B denote the event that all cells are nega-
tive. Describe the sample space graphically and display each
Reproduce the igure and shade the region that corresponds to
of the following events:
each of the following events. (a) A (b) B
(
B′
(a) A′ (b) A∩ B) ∪( A∩ ) (c) A∩ B (d) A∪ B
(
(
(c) A∩ B) ∪ C (d) B ∪ C)′ 2-26. Disks of polycarbonate plastic from a supplier are
(
(e) A∩ B) ∪′ C analyzed for scratch and shock resistance. The results from 100
2-21. A digital scale that provides weights to the nearest disks are summarized here:
gram is used.
(a) What is the sample space for this experiment? Shock Resistance
Let A denote the event that a weight exceeds 11 grams, let B High Low
denote the event that a weight is less than or equal to 15 grams, Scratch High 70 9
and let C denote the event that a weight is greater than or equal
Resistance Low 16 5
to 8 grams and less than 12 grams.
Describe the following events. Let A denote the event that a disk has high shock resistance, and
(b) A∪ B (c) A∩ B let B denote the event that a disk has high scratch resistance.
′
(d) A′ (e) A∪ ∪ C Determine the number of disks in A ∩ B, A , and A∪ B.
B
(
(f) A∪ C)′ (g) A∩ ∩ C 2-27. Samples of a cast aluminum part are classiied on the
B
(h) B′ ′ C (i) A∪( B ∩ C) basis of surface inish (in microinches) and edge inish. The
results of 100 parts are summarized as follows:
2-22. In an injection-molding operation, the length and width,
denoted as X and Y , respectively, of each molded part are eval- Edge Finish
uated. Let Excellent Good
A denote the event of 48 < X < 52 centimeters Surface Excellent 80 2
B denote the event of 9 < Y < 11 centimeters
Finish Good 10 8
Construct a Venn diagram that includes these events. Shade the
(a) Let A denote the event that a sample has excellent sur-
areas that represent the following: face inish, and let B denote the event that a sample has
(a) A (b) A∩ B excellent edge inish. Determine the number of samples in
(c) A′ B (d) A∩ B A′ ∩ B, B′ and in A∪ B.
(e) If these events were mutually exclusive, how successful
(b) Assume that each of two samples is to be classiied on the
would this production operation be? Would the process pro-
basis of surface inish, either excellent or good, and on the
duce parts with X = 50 centimeters and Y = 10 centimeters?
basis of edge inish, either excellent or good. Use a tree dia-
2-23. Four bits are transmitted over a digi- gram to represent the possible outcomes of this experiment.
tal communications channel. Each bit is either distorted or
2-28. Samples of emissions from three suppliers are clas-
received without distortion. Let Ai denote the event that the siied for conformance to air-quality speciications. The results
ith bit is distorted, i = 1 ,… ,4.
from 100 samples are summarized as follows:
(a) Describe the sample space for this experiment.
(b) Are the A i ’s mutually exclusive? Conforms
Describe the outcomes in each of the following events:
(d) A 1 ′ Yes No
(c) A 1
(e) A 1 ∩ A 2 ∩ A 3 ∩ A 4 (f) ( A 1 ∩ ) ∪( A 3 ∩ ) 1 22 8
A 2
A 4
2-24. In light-dependent photosynthesis, light quality refers Supplier 2 25 5
to the wavelengths of light that are important. The wavelength 3 30 10
of a sample of photosynthetically active radiations (PAR) is Let A denote the event that a sample is from supplier 1, and let
measured to the nearest nanometer. The red range is 675–700 B denote the event that a sample conforms to speciications.
′
nm and the blue range is 450–500 nm. Let A denote the event Determine the number of samples in A′ ∩ B, B , and A∪ B.