
Page 52 - Applied statistics and probability for engineers
P. 52
30 Chapter 2/Probability
Complete Let A denote the event that the patient was treated with riba-
Response Total virin plus interferon alfa, and let B denote the event that the
Ribavirin plus interferon alfa 16 21 response was complete. Determine the number of patients in
each of the following events.
Interferon alfa 6 19
Untreated controls 0 20 (a) A (b) A∩ B (c) A∪ B (d) A′ ∩ B′
2-2 Interpretations and Axioms of Probability
In this chapter, we introduce probability for discrete sample spaces—those with only a inite
(or countably ininite) set of outcomes. The restriction to these sample spaces enables us to
simplify the concepts and the presentation without excessive mathematics.
Probability is used to quantify the likelihood, or chance, that an outcome of a random
experiment will occur. “The chance of rain today is 30%” is a statement that quantiies our
feeling about the possibility of rain. The likelihood of an outcome is quantiied by assigning a
number from the interval [0, 1] to the outcome (or a percentage from 0 to 100%). Higher num-
bers indicate that the outcome is more likely than lower numbers. A 0 indicates an outcome
will not occur. A probability of 1 indicates that an outcome will occur with certainty.
The probability of an outcome can be interpreted as our subjective probability, or degree of
belief, that the outcome will occur. Different individuals will no doubt assign different proba-
bilities to the same outcomes. Another interpretation of probability is based on the conceptual
model of repeated replications of the random experiment. The probability of an outcome is
interpreted as the limiting value of the proportion of times the outcome occurs in n repetitions
of the random experiment as n increases beyond all bounds. For example, if we assign prob-
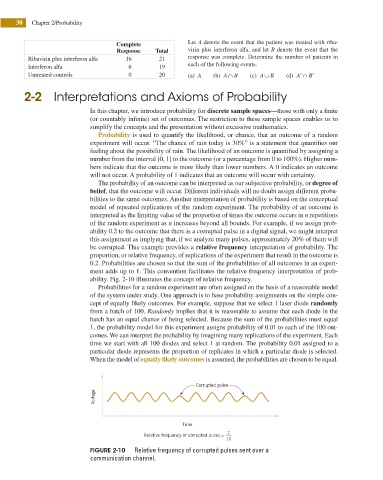
ability 0.2 to the outcome that there is a corrupted pulse in a digital signal, we might interpret
this assignment as implying that, if we analyze many pulses, approximately 20% of them will
be corrupted. This example provides a relative frequency interpretation of probability. The
proportion, or relative frequency, of replications of the experiment that result in the outcome is
0.2. Probabilities are chosen so that the sum of the probabilities of all outcomes in an experi-
ment adds up to 1. This convention facilitates the relative frequency interpretation of prob-
ability. Fig. 2-10 illustrates the concept of relative frequency.
Probabilities for a random experiment are often assigned on the basis of a reasonable model
of the system under study. One approach is to base probability assignments on the simple con-
cept of equally likely outcomes. For example, suppose that we select 1 laser diode randomly
from a batch of 100. Randomly implies that it is reasonable to assume that each diode in the
batch has an equal chance of being selected. Because the sum of the probabilities must equal
1, the probability model for this experiment assigns probability of 0.01 to each of the 100 out-
comes. We can interpret the probability by imagining many replications of the experiment. Each
time we start with all 100 diodes and select 1 at random. The probability 0.01 assigned to a
particular diode represents the proportion of replicates in which a particular diode is selected.
When the model of equally likely outcomes is assumed, the probabilities are chosen to be equal.
Corrupted pulse
Voltage
Time
Relative frequency of corrupted pulse = 2
10
FIGURE 2-10 Relative frequency of corrupted pulses sent over a
communication channel.