
Page 154 - Artificial Intelligence in the Age of Neural Networks and Brain Computing
P. 154
2. AI Development 143
(A) (B)
(C) (D)
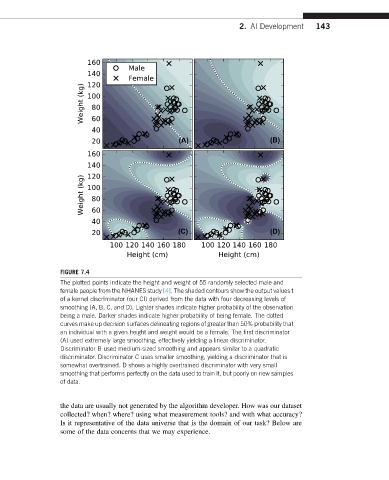
FIGURE 7.4
The plotted points indicate the height and weight of 55 randomly selected male and
female people from the NHANES study [4]. The shaded contours show the output values t
of a kernel discriminator (our CI) derived from the data with four decreasing levels of
smoothing (A, B, C, and D). Lighter shades indicate higher probability of the observation
being a male. Darker shades indicate higher probability of being female. The dotted
curves make up decision surfaces delineating regions of greater than 50% probability that
an individual with a given height and weight would be a female. The first discriminator
(A) used extremely large smoothing, effectively yielding a linear discriminator.
Discriminator B used medium-sized smoothing and appears similar to a quadratic
discriminator. Discriminator C uses smaller smoothing, yielding a discriminator that is
somewhat overtrained. D shows a highly overtrained discriminator with very small
smoothing that performs perfectly on the data used to train it, but poorly on new samples
of data.
the data are usually not generated by the algorithm developer. How was our dataset
collected? when? where? using what measurement tools? and with what accuracy?
Is it representative of the data universe that is the domain of our task? Below are
some of the data concerns that we may experience.