
Page 152 - Artificial Intelligence in the Age of Neural Networks and Brain Computing
P. 152
1. Introduction 141
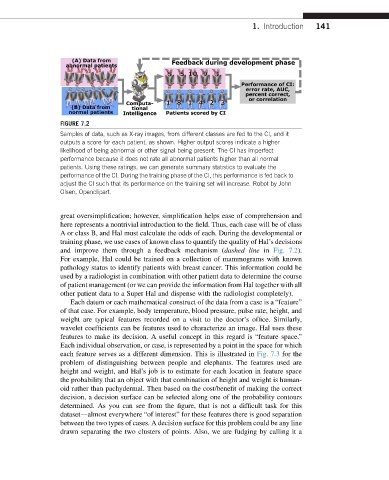
FIGURE 7.2
Samples of data, such as X-ray images, from different classes are fed to the CI, and it
outputs a score for each patient, as shown. Higher output scores indicate a higher
likelihood of being abnormal or other signal being present. The CI has imperfect
performance because it does not rate all abnormal patients higher than all normal
patients. Using these ratings, we can generate summary statistics to evaluate the
performance of the CI. During the training phase of the CI, this performance is fed back to
adjust the CI such that its performance on the training set will increase. Robot by John
Olsen, Openclipart.
great oversimplification; however, simplification helps ease of comprehension and
here represents a nontrivial introduction to the field. Thus, each case will be of class
A or class B, and Hal must calculate the odds of each. During the developmental or
training phase, we use cases of known class to quantify the quality of Hal’s decisions
and improve them through a feedback mechanism (dashed line in Fig. 7.2).
For example, Hal could be trained on a collection of mammograms with known
pathology status to identify patients with breast cancer. This information could be
used by a radiologist in combination with other patient data to determine the course
of patient management (or we can provide the information from Hal together with all
other patient data to a Super Hal and dispense with the radiologist completely).
Each datum or each mathematical construct of the data from a case is a “feature”
of that case. For example, body temperature, blood pressure, pulse rate, height, and
weight are typical features recorded on a visit to the doctor’s office. Similarly,
wavelet coefficients can be features used to characterize an image. Hal uses these
features to make its decision. A useful concept in this regard is “feature space.”
Each individual observation, or case, is represented by a point in the space for which
each feature serves as a different dimension. This is illustrated in Fig. 7.3 for the
problem of distinguishing between people and elephants. The features used are
height and weight, and Hal’s job is to estimate for each location in feature space
the probability that an object with that combination of height and weight is human-
oid rather than pachydermal. Then based on the cost/benefit of making the correct
decision, a decision surface can be selected along one of the probability contours
determined. As you can see from the figure, that is not a difficult task for this
datasetdalmost everywhere “of interest” for these features there is good separation
between the two types of cases. A decision surface for this problem could be any line
drawn separating the two clusters of points. Also, we are fudging by calling it a