Page 203 - Automated Fingerprint Identification Systems (AFIS)
P. 203

188  AUTOMATED FINGERPRINT IDENTIFICATION SYSTEMS
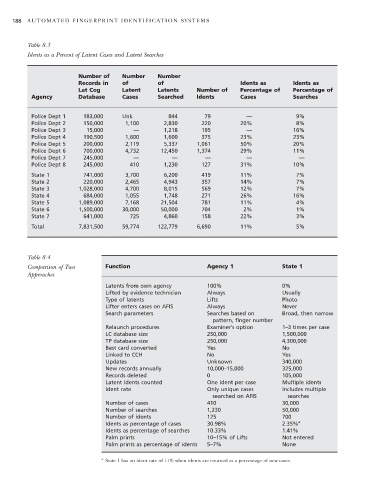


         Table 8.3
         Idents as a Percent of Latent Cases and Latent Searches

                        Number of    Number    Number
                        Records in   of        of                      Idents as      Idents as
                        Lat Cog      Latent    Latents    Number of    Percentage of  Percentage of
          Agency        Database     Cases     Searched   Idents       Cases          Searches


          Police Dept 1  183,000     Unk          844       79           —             9%
          Police Dept 2  150,000     1,100       2,830      220        20%             8%
          Police Dept 3   15,000        —        1,218      195          —            16%
          Police Dept 4  190,500     1,600       1,600      375        23%            23%
          Police Dept 5  200,000     2,119       5,337    1,061        50%            20%
          Police Dept 6  700,000     4,732      12,450    1,374        29%            11%
          Police Dept 7  245,000        —          —         —           —              —
          Police Dept 8  245,000       410       1,230      127        31%            10%
          State 1        741,000     3,700       6,200      419        11%             7%
          State 2        220,000     2,465       4,943      357        14%             7%
          State 3       1,028,000    4,700       8,015      569        12%             7%
          State 4        684,000     1,055       1,748      271        26%            16%
          State 5       1,089,000    7,168      21,504      781        11%             4%
          State 6       1,500,000    30,000     50,000      704         2%             1%
          State 7        641,000       725       4,860      158        22%             3%
          Total         7,831,500    59,774    122,779    6,690        11%             5%


         Table 8.4
         Comparison of Two      Function                     Agency 1              State 1
         Approaches
                                Latents from own agency      100%                  0%
                                Lifted by evidence technician  Always              Usually
                                Type of latents              Lifts                 Photo
                                Lifter enters cases on AFIS  Always                Never
                                Search parameters            Searches based on     Broad, then narrow
                                                               pattern, finger number
                                Relaunch procedures          Examiner’s option     1–3 times per case
                                LC database size             250,000               1,500,000
                                TP database size             250,000               4,300,000
                                Best card converted          Yes                   No
                                Linked to CCH                No                    Yes
                                Updates                      Unknown               340,000
                                New records annually         10,000–15,000         325,000
                                Records deleted              0                     105,000
                                Latent idents counted        One ident per case    Multiple idents
                                Ident rate                   Only unique cases     Includes multiple
                                                               searched on AFIS      searches
                                Number of cases              410                   30,000
                                Number of searches           1,230                 50,000
                                Number of idents             125                   700
                                Idents as percentage of cases  30.98%              2.35% a
                                Idents as percentage of searches  10.33%           1.41%
                                Palm prints                  10–15% of Lifts       Not entered
                                Palm prints as percentage of idents  5–7%          None

                              a
                                State 1 has an ident rate of 11% when idents are counted as a percentage of new cases.
   198   199   200   201   202   203   204   205   206   207   208