
Page 699 - Automotive Engineering Powertrain Chassis System and Vehicle Body
P. 699
CHAP TER 2 1. 1 Interior noise: Assessment and control
0.61@1000Hzforanunoccupied,leather-upholstered Using the data from Tables 21.1-4 and 21.1-5:
seat;
0.03 @ 1000 Hz for glass. R cloth ¼ 14:98
From Haines (1987), maximum absorption coefficients R ¼ 11:53
(method of measurement unknown) for a molded glass leather
fibre headliner are: So the likely effect of fitting cloth seats rather than
0.60 @ 1000 Hz for 13-mm thick liner. leather seats would be (without passengers)
From Saha and Baker (1987), maximum absorption co- 10 log 10 R cloth =R leather ¼ 1:1 dB reduction in the
efficients (measured in a reverberation room) are sound due to the reverberant field.
This seems a rather modest reduction in reverberant
0.18 @ 1000 Hz for a 6-mm thick carpet; and
sound level (remember, the level due to direct sound is
0.42 @ 1000 Hz for a 12-mm thick carpet. not considered in the above analysis), although Quian and
For cloth seats and leather seats see Tables 21.1-4 and Vanbuskirk (1995) suggest that making the change in seat
21.1-5. covering resulted in measurable and noticeable differences
The surface average absorption coefficient is in this in interior sound levels during some modes of actual ve-
case for cloth seats is (without passengers) a ¼ 0:41. hicle operation. Speech intelligibility was improved.
Therefore, the average T 60 @ 1000 Hz would be 58 ms One may decide whether the driver is likely to be
for upholstered seats (without passengers). The surface influenced most by direct of reverberant sound using the
average absorption coefficient in this case for leather relationship
seats is (without passengers), a ¼ 0:35. Therefore, the
average T 60 @ 1000 Hz would be 68 ms for leather seats I r 16pr 2
(without passengers). I ¼ Sa (21.1.81)
The two reverberation times estimated above broadly d
agree with the typical, measured reverberation times where I r and I d are the reverberant and direct sound in-
shown (Quian and Vanbuskirk, 1995), these being in the tensities, respectively. It can be seen that for the earlier
range of 70–90 ms. case with cloth seats, the reverberant and direct in-
From Section 21.1.3.5 it is known that the contribu- tensities are equal (according to this simple model, as-
tion to interior sound pressure levels from the re- suming a diffuse space) at a distance of 0.4 m. So, when
verberant field in a semi-diffuse environment is given by: the driver’s ears are less than 0.4 m from a noise source
(like the side windows and the roof) the direct field will
4
DLp rev ¼ 10 log 10 (21.1.79) dominate and noise levels will be little affected by
R
changes in the total absorption of the space. However, at
longer distances from sources (the windscreen, the rear
where the room constant R is:
screen, the footwell, the rear floor) an increase of ab-
Sa sorption will reduce the interior noise levels to at least
R ¼ (21.1.80)
1 a some degree.
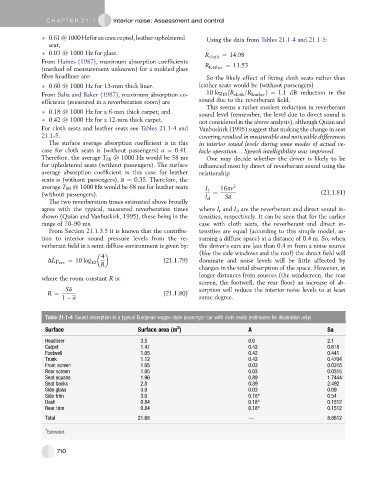
Table 21.1-4 Sound absorption in a typical European wagon style passenger car with cloth seats (estimates for illustration only)
2
Surface Surface area (m ) A Sa
Headliner 3.5 0.6 2.1
Carpet 1.47 0.42 0.618
Footwell 1.05 0.42 0.441
Trunk 1.12 0.42 0.4704
Front screen 1.05 0.03 0.0315
Rear screen 1.05 0.03 0.0315
Seat squabs 1.96 0.89 1.7444
Seat backs 2.8 0.89 2.492
Side glass 3.0 0.03 0.09
Side trim 3.0 0.18* 0.54
Dash 0.84 0.18* 0.1512
Rear trim 0.84 0.18* 0.1512
Total 21.68 d 8.8612
* Estimated.
710