
Page 198 - Autonomous Mobile Robots
P. 198
182 Autonomous Mobile Robots
0.03
0.025
Position error (m) 0.015
0.02
0.01
0.005
0.5 1 1.5 2 2.5 3 3.5 4 4.5 5 5.5
Range (m)
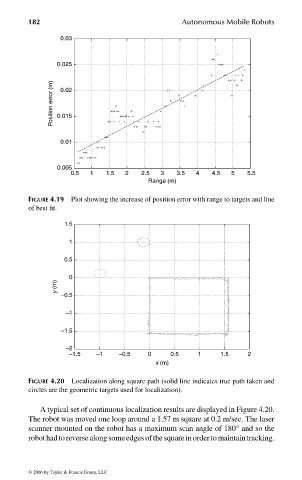
FIGURE 4.19 Plot showing the increase of position error with range to targets and line
of best fit.
1.5
1
0.5
0
y (m)
– 0.5
– 1
– 1.5
– 2
– 1.5 – 1 – 0.5 0 0.5 1 1.5 2
x (m)
FIGURE 4.20 Localization along square path (solid line indicates true path taken and
circles are the geometric targets used for localization).
A typical set of continuous localization results are displayed in Figure 4.20.
The robot was moved one loop around a 1.57 m square at 0.2 m/sec. The laser
◦
scanner mounted on the robot has a maximum scan angle of 180 and so the
robothadtoreversealongsomeedgesofthesquareinordertomaintaintracking.
© 2006 by Taylor & Francis Group, LLC
FRANKL: “dk6033_c004” — 2006/3/31 — 16:42 — page 182 — #34