Page 78 - Autonomous Mobile Robots
P. 78

Millimeter Wave RADAR Power-Range Spectra Interpretation    61

                                 (a)  40
                                     35
                                     30
                                   Returned power (dB)  20
                                     25

                                     15
                                     10
                                      5
                                      0
                                     –5
                                    –10
                                       0      20      40      60      80      100     120
                                                           Range (m)

                                   (b)  40

                                      35
                                      30

                                      25
                                     Returned power (dB)  20


                                      15

                                      10
                                       5

                                       0

                                      –5

                                     –10
                                        0      20      40     60     80     100     120
                                                          Distance (m)

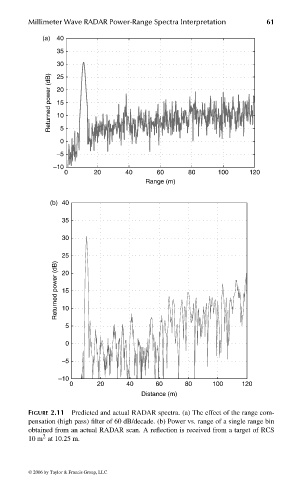
                              FIGURE 2.11  Predicted and actual RADAR spectra. (a) The effect of the range com-
                              pensation (high pass) filter of 60 dB/decade. (b) Power vs. range of a single range bin
                              obtained from an actual RADAR scan. A reflection is received from a target of RCS
                                 2
                              10 m at 10.25 m.


                              © 2006 by Taylor & Francis Group, LLC


                                 FRANKL: “dk6033_c002” — 2006/3/31 — 17:29 — page 61 — #21
   73   74   75   76   77   78   79   80   81   82   83