
Page 84 - Autonomous Mobile Robots
P. 84
Millimeter Wave RADAR Power-Range Spectra Interpretation 67
(b) 100
RADAR range bin
Features detected
Adaptive threshold
80
60
Power (dB) 40
20
0
–20
0 20 40 60 80 100 120 140 160 180 200
Range (m)
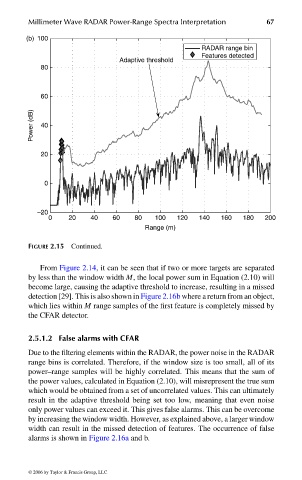
FIGURE 2.15 Continued.
From Figure 2.14, it can be seen that if two or more targets are separated
by less than the window width M, the local power sum in Equation (2.10) will
become large, causing the adaptive threshold to increase, resulting in a missed
detection [29]. This is also shown in Figure 2.16b where a return from an object,
which lies within M range samples of the first feature is completely missed by
the CFAR detector.
2.5.1.2 False alarms with CFAR
Due to the filtering elements within the RADAR, the power noise in the RADAR
range bins is correlated. Therefore, if the window size is too small, all of its
power–range samples will be highly correlated. This means that the sum of
the power values, calculated in Equation (2.10), will misrepresent the true sum
which would be obtained from a set of uncorrelated values. This can ultimately
result in the adaptive threshold being set too low, meaning that even noise
only power values can exceed it. This gives false alarms. This can be overcome
by increasing the window width. However, as explained above, a larger window
width can result in the missed detection of features. The occurrence of false
alarms is shown in Figure 2.16a and b.
© 2006 by Taylor & Francis Group, LLC
FRANKL: “dk6033_c002” — 2006/3/31 — 17:29 — page 67 — #27