
Page 94 - Autonomous Mobile Robots
P. 94
Millimeter Wave RADAR Power-Range Spectra Interpretation 77
(a)
30
20
Power (dB) 50 0 10
0
–30
–20 Distance (m)
–10 –10
0
10 –20
Distance (m)
20
–30
30
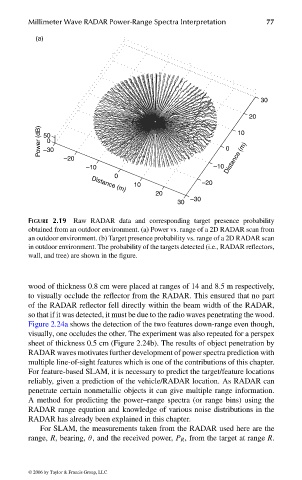
FIGURE 2.19 Raw RADAR data and corresponding target presence probability
obtained from an outdoor environment. (a) Power vs. range of a 2D RADAR scan from
an outdoor environment. (b) Target presence probability vs. range of a 2D RADAR scan
in outdoor environment. The probability of the targets detected (i.e., RADAR reflectors,
wall, and tree) are shown in the figure.
wood of thickness 0.8 cm were placed at ranges of 14 and 8.5 m respectively,
to visually occlude the reflector from the RADAR. This ensured that no part
of the RADAR reflector fell directly within the beam width of the RADAR,
so that if it was detected, it must be due to the radio waves penetrating the wood.
Figure 2.24a shows the detection of the two features down-range even though,
visually, one occludes the other. The experiment was also repeated for a perspex
sheet of thickness 0.5 cm (Figure 2.24b). The results of object penetration by
RADAR waves motivates further development of power spectra prediction with
multiple line-of-sight features which is one of the contributions of this chapter.
For feature-based SLAM, it is necessary to predict the target/feature locations
reliably, given a prediction of the vehicle/RADAR location. As RADAR can
penetrate certain nonmetallic objects it can give multiple range information.
A method for predicting the power–range spectra (or range bins) using the
RADAR range equation and knowledge of various noise distributions in the
RADAR has already been explained in this chapter.
For SLAM, the measurements taken from the RADAR used here are the
range, R, bearing, θ, and the received power, P R , from the target at range R.
© 2006 by Taylor & Francis Group, LLC
FRANKL: “dk6033_c002” — 2006/3/31 — 17:29 — page 77 — #37