
Page 108 - Autonomous Mobile Robots
P. 108
Millimeter Wave RADAR Power-Range Spectra Interpretation 91
(b) 50
A
D
40
30
Power (dB) 20
10
0
–10
–20
0 20 40 60 80 100 120 140 160 180 200
Range (m)
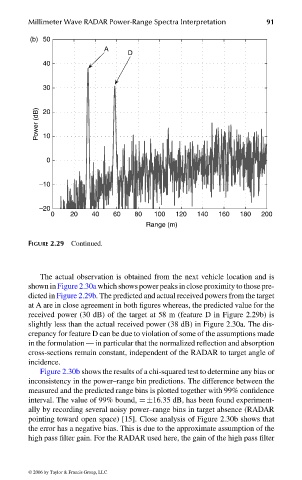
FIGURE 2.29 Continued.
The actual observation is obtained from the next vehicle location and is
shown in Figure 2.30a which shows power peaks in close proximity to those pre-
dicted in Figure 2.29b. The predicted and actual received powers from the target
at A are in close agreement in both figures whereas, the predicted value for the
received power (30 dB) of the target at 58 m (feature D in Figure 2.29b) is
slightly less than the actual received power (38 dB) in Figure 2.30a. The dis-
crepancy for feature D can be due to violation of some of the assumptions made
in the formulation — in particular that the normalized reflection and absorption
cross-sections remain constant, independent of the RADAR to target angle of
incidence.
Figure 2.30b shows the results of a chi-squared test to determine any bias or
inconsistency in the power–range bin predictions. The difference between the
measured and the predicted range bins is plotted together with 99% confidence
interval. The value of 99% bound, =±16.35 dB, has been found experiment-
ally by recording several noisy power–range bins in target absence (RADAR
pointing toward open space) [15]. Close analysis of Figure 2.30b shows that
the error has a negative bias. This is due to the approximate assumption of the
high pass filter gain. For the RADAR used here, the gain of the high pass filter
© 2006 by Taylor & Francis Group, LLC
FRANKL: “dk6033_c002” — 2006/3/31 — 17:29 — page 91 — #51