
Page 109 - Autonomous Mobile Robots
P. 109
92 Autonomous Mobile Robots
(a) 50
40
A
D
30
Power (dB) 20
10
0
–10
–20
0 20 40 60 80 100 120 140 160 180 200
Range (m)
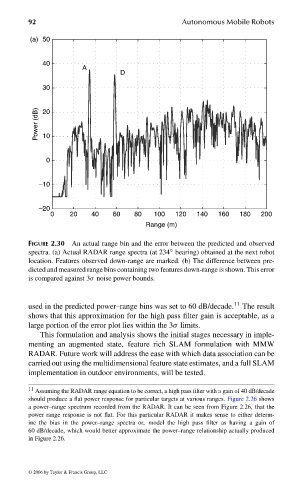
FIGURE 2.30 An actual range bin and the error between the predicted and observed
◦
spectra. (a) Actual RADAR range spectra (at 234 bearing) obtained at the next robot
location. Features observed down-range are marked. (b) The difference between pre-
dicted and measured range bins containing two features down-range is shown. This error
is compared against 3σ noise power bounds.
used in the predicted power–range bins was set to 60 dB/decade. 11 The result
shows that this approximation for the high pass filter gain is acceptable, as a
large portion of the error plot lies within the 3σ limits.
This formulation and analysis shows the initial stages necessary in imple-
menting an augmented state, feature rich SLAM formulation with MMW
RADAR. Future work will address the ease with which data association can be
carried out using the multidimensional feature state estimates, and a full SLAM
implementation in outdoor environments, will be tested.
11 Assuming the RADAR range equation to be correct, a high pass filter with a gain of 40 dB/decade
should produce a flat power response for particular targets at various ranges. Figure 2.26 shows
a power–range spectrum recorded from the RADAR. It can be seen from Figure 2.26, that the
power range response is not flat. For this particular RADAR it makes sense to either determ-
ine the bias in the power–range spectra or, model the high pass filter as having a gain of
60 dB/decade, which would better approximate the power–range relationship actually produced
in Figure 2.26.
© 2006 by Taylor & Francis Group, LLC
FRANKL: “dk6033_c002” — 2006/3/31 — 17:29 — page 92 — #52