
Page 115 - Basic Well Log Analysis for Geologist
P. 115
(a
hydrocarbon-bearing zones corrects for the hydrocarbons in (formation factor) curve plotted with the bulk density log.
the pores when water saturation (Sy) is known. When a formation’s R, is known, an R, curve can be
The Dresser Atlas conductivity derived porosity curves created by overlaying and tracing an F curve on the
are calculated by assuming all zones are water-bearing (i.e. resistivity log.
, = R,). Therefore, hydrocarbon-bearing zones show up
as a loss of conductivity dertved porosity because R, is
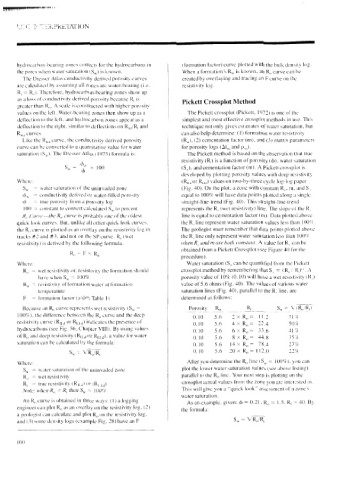
Pickett Crossplot Method
greater than R,. A scale is constructed with higher porosity
values on the left. Water-bearing zones then show up as a The Pickett crossplot (Pickett, 1972) is one of the
deflection to the left, and hydrocarbon zones appear as a simplest and most effective crossplot methods in use. This
deflection to the right. similar to deflections on R,,/R, and technique not only gives estimates of water saturation, but
Ry curves. can also help determine: (1) formation water resistivity
Like the R,,, curve, the conductivity derived porosity (R,), (2) cementation factor (m), and (3) matrix parameters
curve can be converted to a quantitative value for water for porosity logs (At,, and p,,,).
saturation (S,.). The Dresser Atlas (1975) formula ts: The Pickett method is based on the observation that true
resistivity (R,) is a function of porosity (), water saturation
ib Ww
= b x 100 (S,), and cementation factor (m). A Pickett crossplot is
Sy w
developed by plotting porosity values with deep resistivity
Where (Ry, or Ry) values on two-by-three cycle log-log paper
S, = water saturation of the uninvaded zone (Fig. 40). On the plot, a zone with constant R,, m. and S,
oy = conductivity derived or water-filled porosity equal to [00% will have data points plotted along a single,
= true porosity from a porosity log straight-line-trend (Fig. 40). This straight-line-trend
100 = constant to convert calculated S,, to percent represents the R,, (wet resistivity) line. The slope of the R,
RK, Curve—the R, curve is probably one of the oldest line is equal to cementation factor (m). Data plotted above
quick look curves. But, unlike all other quick look curves, the R, line represent water saturation values less than LOO.
the R, curve is plotted as an overlay on the resistivity log in The geologist must remember that data points plotted above
tracks #2 and #3, and not onthe SP curve. R, (wet the R, line only represent water saturation Jess than 100%
resisuvitv) is derived by the following formula. when R, and mare both constant. A value for R, cun be
obtained from a Pickett Crossplot (see Figure 40 for the
R,= FX R,
°
procedure).
Where: Water saturation (S, can be quantified from the Pickett
R, = wet resistivity or. resistivity the formation should crossplot method by remembering that S, = (R,/ RR). A
have when S, = LO0% porosity value of 10% (0.10) will have a wet resistivity (R,)
Ry = resistivity of formation water at formation value of 5.6 ohms (Fig. 40). The values of various water
temperature saturation lines (Fig. 40), parallel to the R, line. are
F = formation factor (a/b; Table 1) determined as follows:
Because an R, curve represents wet resistivity (Sy = Porosity R, R, Sy = WIR YR)
100%), the difference between the R, curve and the deep
0.10 5.6 2x*KR = 11.2 TL
resistivity curve (Ry y or Ruy g) indicates the presence of
0.10 5.6 4xR,= 22.4 50%
hydrocarbons (see Fig. 56, Chapter VII). By using values
0.10 5.6 6x R,= 33.6 4%
of R, and deep resistivity (Ry or Rpg). a Value for water
g
0.10 5.6 8x R,= 44.8 35%
saturation can be calculated by the formula: 0.10 5.6 14xXR,= 78.4 27%
Sy =v R,/ R, 0.10 5.6 20*R,= 112.0 22%
Where After you determine the R, line (Sy = 100%). you can
Sy = water saturation of the aninvaded zone plot the lower water saturation values (see above listing)
R, = wel resistivity parallel to the R, line. Your next step ts plotting on the
R, = true resistivity (Ry g) or (Ryyg) crossplot actual values from the zone you are interested in.
Note: when R, = R, then Sy, = 100% This will give you a “quick look” assessment of a zone’s
An R, curve Is obtained in three ways: (1) a logging water saturation.
As an example, given: @ = 0.21. R, = 1.5. R, = 40. By
engineer can plot R, as an overlay on the resistivity log. (2) the formula:
a geologist can calculate and plot R, on the resistivity log,
and (3) some density logs (example Fig. 28) have an F S, = VR/R,