Page 122 - Basic Well Log Analysis for Geologist
P. 122

LOG  INTERPRETATION


                                         IPF=292  BO+I3  BWPD
                                               96%  OIL


                                                       ww
                                                 “—
                                              .O6   ———_
                                                   ee
                                            04


                       -_
                           +

                      .05   40   AS
                                POROSITY,  @

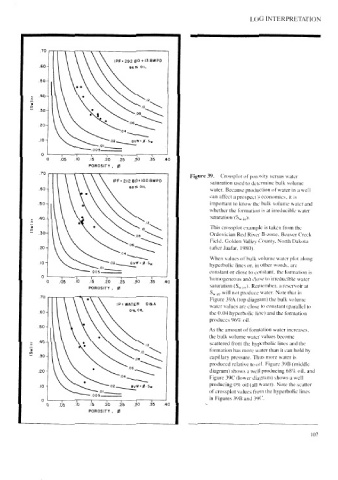
                                                                    Figure  39.   Crossplot  of  porosity  versus  water
                                         IPF = 212  BO+100  BWPD
                                                                           saturation  used  to  determine  bulk  volume
                                              68%  OIL
                                                                           water.  Because  production  of  water  in  a  well
                                                                           can  affect  a  prospect's  economics,  it  is
                                                                           important  to  know  the  bulk  volume  water  and
                                                                           whether  the  formation  is  at  irreducible  water
                                                                           saturation  (Sy  ;,,).
                                                                           This  crossplot  cxample  is  taken  from  the
                                                                           Ordovician  Red  River  B-zone,  Beaver  Creck
                                                                           Field.  Golden  Valley  County,  North  Dakota
                                                                           (after  Jaafar,  1980).
                                                                           When  values  of  bulk  volume  water  plot  along

                                                                           hyperbolic  lines  or,  in  other  words,  are


                                 T   005   T                               constant  or  close  to  constant,  the  formation  ts
                                                                           homogeneous  and  close  to  irreducible  water
                                AS    .20
                                                                           saturation  (Sy,  ;,-).  Remember,  a  reservoir  at
                                POROSITY,   @
                                                                           Sw  in  Will  not  produce  water.  Note  that  in

                                                                           Figure  39A  (top  diagram)  the  bulk  volume
                                          IP=WATER   O&A
                                                                           water  values  are  close  to  constant  (parallel  to
                                               O%  OIL
                                                                           the  0.04  hyperbolic  line)  and  the  formation
                                                                           produces  96%  oil.
                                                                           formation  has  more  water  than  it  can  hold  by
                                                                           As  the  amount  of  formation  water  increases.
                                                                           the  bulk  volume  water  values  become
                                                                           scattered  from  the  hyperbolic  lines  and  the
                                                                           capillary  pressure.  Thus  more  water  is
                                                                           produced  relative  to  oil.  Figure  39B  (middle
                                                                           diagram)  shows  a  well  producing  68%  oil,  and


                                                                           Figure  39C  (lower  diagram)  shows  a  well
                                                                           producing  0%  oil  (all  water).  Note  the  scatter
                                          —~—_BYW Sw
                                                   8
                                                                           of  crossplot  values  froin  the  hyperbolic  lines
                                                                           in  Figures  39B  and  39C.
                                                 T
                                       T
                           TOT
                                                      TT

                                 15
                                                          40
                           10
                                      .20
                                                30
                                                     35
                                           25
                                          @
                                POROSITY,

                                                                                                              107
   117   118   119   120   121   122   123   124   125   126   127