
Page 124 - Basic Well Log Analysis for Geologist
P. 124
LOG INTERPRETATION
a
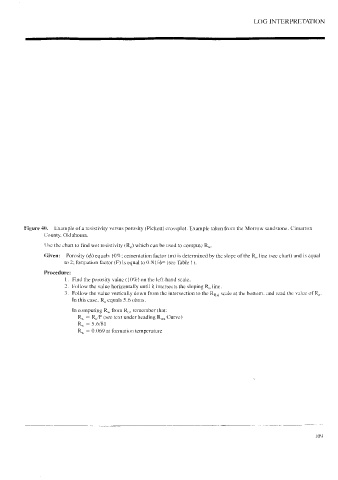
Figure 40, Example of resistivity versus porosity (Pickett) crossplot. Example taken from the Morrow sandstone, Cimarron
County, Oklahoma.
Use the chart to find wet resistivity (R,) which can be used to compute R,,.
Given: Porosity (@) equals 10%; cementation factor (m) is determined by the slope of the R,, [tne (sce chart) and is equal
to 2; formation factor (F) is equal to 0.81/d™ (see Table |).
Procedure:
|. Find the porosity value (10%) on the left-hand scale.
2. Follow the value horizontally until it intersects the sloping R, line.
y
3. Follow the value vertically down from the intersection to the Ry scale at the bottom, and read the value of Ry.
In this case. R, equals 5.6 ohms.
In computing R,, from R,, remember that:
R, = R,/F (see text under heading R,,, Curve)
R, = 5.6/81
R,. = 0.069 at formation temperature
109