
Page 128 - Basic Well Log Analysis for Geologist
P. 128
LOG INTERPRETATION
a
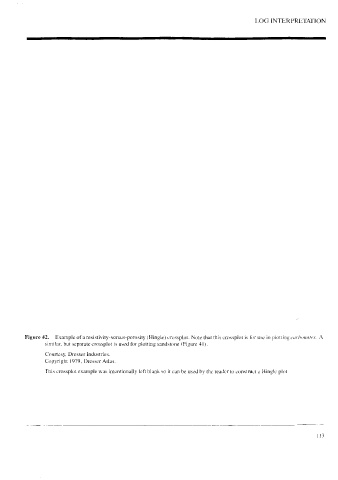
Figure 42. Example of resistivity-versus-porosity (Hingle) erossplot. Note that this crossplot is for use in plotting carbonates. A
similar, but separate crossplot is used tor plotting sandstone (Figure 41).
Courtesy, Dresser Industries.
Copyright 1979, Dresser Atlas.
This crossplot example was intentionally left blank so it can be used by the reader to construct a Hingle plot