
Page 140 - Basic Well Log Analysis for Geologist
P. 140
LITHOLOGY LOGGING AND MAPPING TECHNIQUES
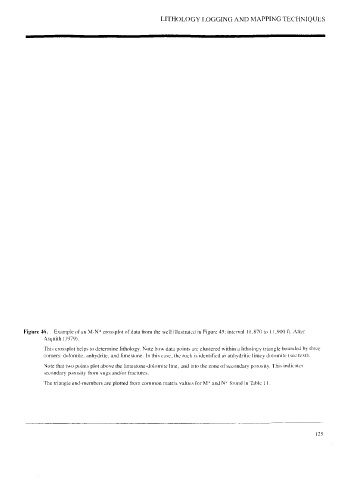
Figure 46, Example of an M-N* crossplot of data from the well illustrated in Figure 45, interval 11,870 to 11,900 ft. After
Asquith (1979).
This crossplot helps to determine lithology. Note how data points are clustered within a lithology triangle bounded by three
corners: dolomite, anhydrite, and limestone. In this case, the rock is identified as anhydritic limey dolomite (see text).
Note that two points plot above the limestone-dolomite line, and into the zone of secondary porosity. This indicates
secondary porosity from vugs and/or fractures.
The triangle end-members are plotted from common matrix values for M* and N* found in Table I 1.
125