
Page 161 - Basic Well Log Analysis for Geologist
P. 161
wUU INTERPRETATION CASE STUDIES
SHALE INDEX WET RESISTIVITY WATER POROSITY
OHMS M?/M SATURATION ANALYSIS
1000] 100 Oj 25 °
2
GRAIN DENSITY > DEEP RESISTIVITY CALIPER (~) BIT SIZE
o CHMS M“/M E
oS
m 1000] -20
z
a
a
5
2
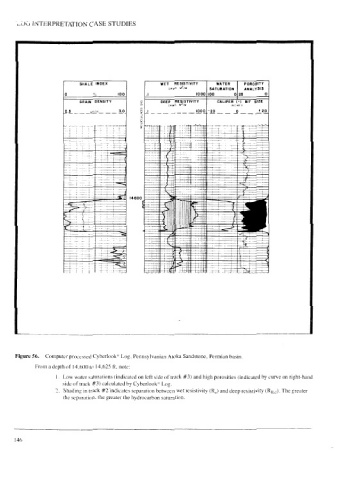
Figure 56. Computer processed Cyberlook* Log. Pennsylvanian Atoka Sandstone, Permian basin.
From a depth of 14,600 to 14,625 ft. note:
1. Low water saturations (indicated on left side of track #3) and high porosities (indicated by curve on right-hand
side of track #3) calculated by Cyberlook* Log.
2. Shading in track #2 indicates separation between wet resistivity (R,) and deep resistivity (Ry. q). The greater
the separation, the greater the hydrocarbon saturation.
146