Page 170 - Basic Well Log Analysis for Geologist
P. 170

LOG  INTERPRETATION  CASE  STUDIES


                                                          —-~  BRHO (6/63)  _
                                                                      0.4500
                                 CALI  (IN)                               (OHMM  )
                                                                       RHOB  (6/C3)


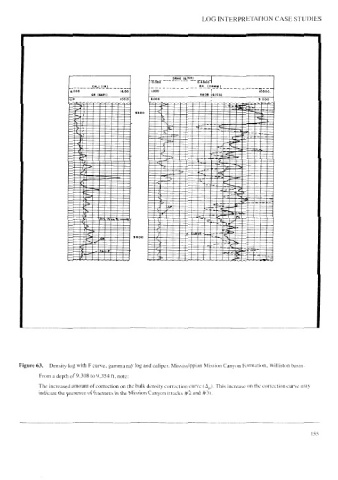
        Figure  63.   Density  log  with  F  curve,  gamma  ray  log  and  caliper.  Mississippian  Mission  Canyon  Formation,  Williston  basin.
               From  a  depth  of  9,308  to  9,354  ft,  note:
               The  increased  amount  of  correction  on  the  bulk  density  correction  curve  (4,,).  This  increase  on  the  correction  curve  may
               indicate  the  presence  of  fractures  in  the  Mission  Canyon  (trucks  #2  and  #3).


                                                                                                                nr   A
   165   166   167   168   169   170   171   172   173   174   175