
Page 178 - Basic Well Log Analysis for Geologist
P. 178
LOG INTERPRETATION CASE STUDIES
Caen ene eeeee errr reer errr reer reer eee eee eee TS
6
©
,microsec/ft | (At maja o ° 6
nnn A
Mean
|
/
—
Z
T
TIME 60 { ° °
TRANSIT
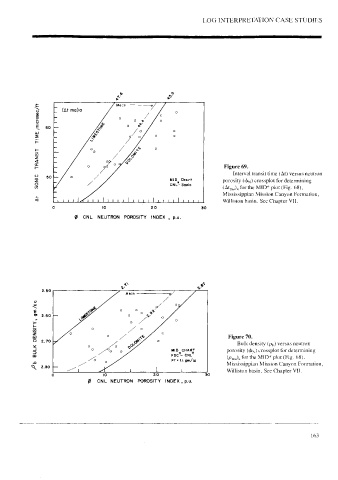
Figure 69.
Interval transit time (At) versus neutron
SONIC Peau w MID Chart porosity (dy) crossplot for determining
50
CNL- Sonic
(Atma for the MID* plot (Fig. 68),
At _— tin gy Mississippian Mission Canyon Formation,
prirtirrrirtirirtizrypy
Williston basin. See Chapter VII.
0 10 20 30
g CNL NEUTRON POROSITY INDEX , p.u.
\ A
a a
2.50
/
gm/cc 2.60 °
DENSITY, °o Figure 70.
Bulk density (p,) versus neutron
BULK MID CHART porosity (@y) crossplot for determining
te Lt sm/ee
(Pma), for the MID* plot (Fig. 68).
/b , Mississippian Mission Canyon Formation,
|
L
Williston basin. See Chapter VII.
20 30
@ CNL NEUTRON POROSITY INCEX, p.u.
163