
Page 179 - Basic Well Log Analysis for Geologist
P. 179
LUG INTERPRETATION CASE STUDIES
z
2.5
mR J 8
J am
38 —0 &
° 7 w
& © 1 2
2.6 7
> ° 4
‘Ss io
wo Fs
z 7 =
4
oa
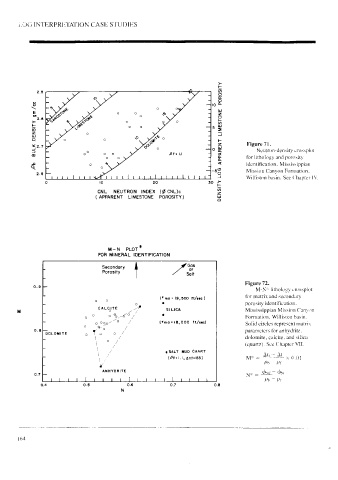
a ‘ 3 “ ° a bE Figure 71.
2.7 ° _ Gi
eS
i) Ox Neutron-density crossplot
D Att 4 «4 for lithology and porosity
&
7
g {3 identification, Mississippian
2.8 4758 Mission Canyon Formation.
pliadupttiririrtripiy
3 Williston basin. See Chapter IV.
20 30 z
CNL NEUTRON INDEX (@ CNL)c 3
( APPARENT LIMESTONE POROSITY) ra
M-N PLoT*
FOR MINERAL IDENTIFICATION
5 Secondary Gas
Porosity y Salt
Figure 72.
0.9
M-N* lithology crossplot
for matrix and secondary
- oo (¥ma= 19,500 ft/sec)
L ° e porosity identification.
M a calcite =P SILICA Mississippian Mission Canyon
o ° ° 6° / ° Formation, Williston basin.
- 0 Pop” ? / (¥ma=18,000 ft/sec) Solid circles represent matrix
0.8 ° ve / parameters for anhydrite.
“| DOLOMITE ° ar o /
L \ / dolomite, calcite, and silica
, 8 4 (quartz). See Chapter VII.
a \ \ / / e@ SALT MUD CHART
- = \ 2 (At=1.1, atts!85) M# = Ay ~ At x COL
Po — PF
Ww
ANHYDRITE
0.7 NX = ovr — On
|
tp
i
pou
bt
tp
|
pe
Po — PE
0.4 0.3 0.6 0.7 0.8
N
164