
Page 184 - Basic Well Log Analysis for Geologist
P. 184
LOG INTERPRETATION CASE STUDIES
weh- .e- eL
Rwa
7 9 tt 13 iS
wdenbe bia di ae
(inches)
HOLE SIZE 40” INDUCTION RESISTIVITY
1
-Pel+ ‘8 Micro. Seconds /ft.
10 SPECIFIC ACOUSTIC TIME
100.
Millivolts 16 NORMAL
S.P Caliper RESISTIVITY ACOUSTILOG
& Rug Ohms m@/mn 7, rR, 2k,
4
1,
+5 | oi ‘ Lug Lt hk. ft p44 feb et
mage a aeeeb opp tap ps EP So
temp
CEOETH
; O77
70°F
at
: RMF aot meas
'RMC at meas. temp.
-
BIT SIZE
1.29
a1 7TO°F
280°F
MAX
TYPE FLUIO IN HOLE’ OFM
REC. TEMP
Aine
9
i
oF
: 1
| R
| we
-—e eH
LRM ot meas temp. | 1.08 at 70°F
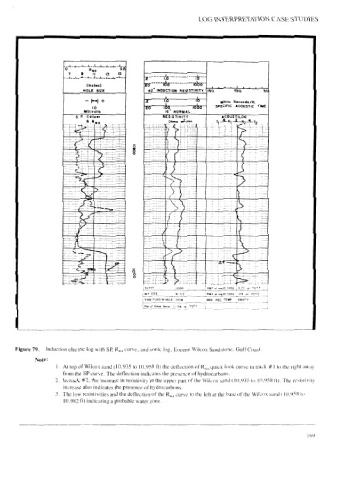
Figure 79. Induction electric log with SP, Ry, curve, and sonic log, Eocene Wilcox Sandstone. Gulf Coast.
Note:
. At top of Wilcox sand (10,935 to 10,958 ft) the deflection of R,,, quick look curve in track #1 to the right away
from the SP curve. The deflection indicates the presence of hydrocarbons.
In track #2, the increase in resistivity in the upper part of the Wilcox sand (10,935 to 10,958 ft). The resistivity
increase also indicates the presence of hydrocarbons.
The low resistivities and the deflection of the Ry, curve to the Ieft at the base of the Wilcox sand (10.958 to
10,982 ft) indicating a probable water zone.
169