
Page 41 - Basic Well Log Analysis for Geologist
P. 41
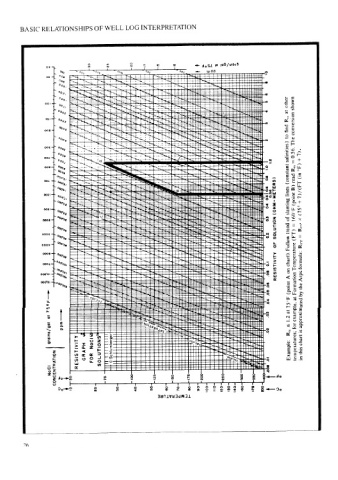
BASIC  RELATIONSHIPS  OF  WELL  LOG  INTERPRETATION


                                30     Les     +20       18          >  4oSz  10  j06/ui0s6
                                 “Oo,                           Po.
                                                    Ong                    dd
                      Ca
                                                H
                      20,
                      09,
                      0,
                      0,4,    :        op.
                      0,,        Jif:                                                                 other   shown
                     09,               r
                                                                                                      at
                 os   og,              dk.                                                            R,,
                              ly                                                                        conversion
                      Q0         whe                                                                  find
                 002  4
                              hf
                      0,                                                                              to
                              |   ;    YA                                                               The
                     S00,
                     00,                                                                              salinities}   0.56.   +7).
                     209,        7                                                                      =
                              Ys                                                                           °F)
                      Oe                                                                                R,,
                     06
                                                                                               os       read
                     0.                                                                               (constant   (in
                                                                                               0510   lines   B)   7)/(FT
                     %p.                                                                          (OHM- METERS)   (point
                                                                                               04     slanting   +
                oogi                                                                                       (75°
                     20,                ;                                                                160°F
                     Og,                                                                       03     of   X
                     Wo,                                                                          SOLUTION   trend   =   R;5)
                ooot  —.  a9.                                                                  0.2       (FT)
                       ‘Oe                                                                                 =
                   11
                coor   a9:  ‘Oe                                                                   OF   Follow   Rrr
                      Oe,                                                                                Temperature
               ooo1—4   005,                                                                   O.   RESISTIVITY   chart).   formula:
                     My                                                                                on
                                                                                               .08
                     Png.                                                                              A   Arps
                                                                                                       (point   the
                     PO,                                                                                 Formation
                  —e>                                                                                    at   by
                   75°F                                                                                75°F

                   ot   eom-~-                                                                         at   1.2   example,   approximated
                   grains/gal     NoC!                                                                 ts   R,,   for  temperatures;   is   chart


                     CONCENTRATION   RESISTIVITY   GRAPH   FOR   SOLUTIONS   Sch   ©                   Example:   this   in

                   NaCl   a   i                                                                ~<«—dJo


                       °  '        20            40                       100   a            § <—  20
                      oO   10                                                 °
                                                         SunivedadW3al


         26