
Page 36 - Basic Well Log Analysis for Geologist
P. 36
BASIC RELATIONSHIPS OF WELL LOG INTERPRETATION
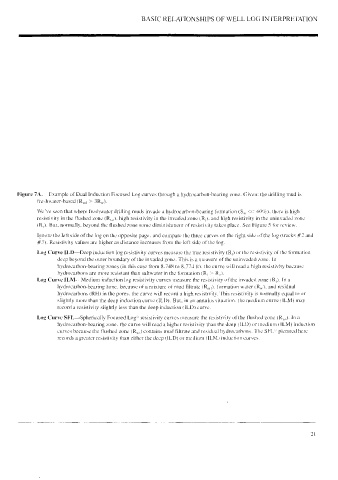
Figure 7A. Example of Dual Induction Focused Log curves through a hydrocarbon-bearing zone. Given: the drilling mud is
freshwater-based (Ry > 3R,.).
We ‘ve seen that where freshwater drilling muds invade a hydrocarbon-bearing formation (S, <<. 60%), there is high
resistivity in the flushed zone (R,,). high resistivity in the invaded zone (Rj), and high resistivity in the uninvaded zone
(R,). But. normally, beyond the flushed zone some diminishment of resistivity takes place. Sce Figure 5 for review.
Ignore the left side of the log on the opposite page. and compare the three curves on the right side of the log (tracks #2 and
#2). Resistivity values are higher as distance increases from the left side of the log.
Log Curve ILD—Deep induction log resistivity curves measure the true resistivity (R,) or the resistivity of the formation
deep beyond the outer boundary of the invaded zone. This is a measure of the uninvaded zone. In
hydrocarbon-bearing zones (in this case trom 8.748 to 8,774 ft), the curve will read a high resistivity because
hydrocarbons are more resistant than saltwater in the formation (R, > R,).
Log Curve ILM—Medium induction log resistivity curves measure the resistivity of the invaded zone (Rj). Ina
hydrocarbon-bearing zone, because of a mixture of mud filtrate (R,-). formation water (Ry), and residual
hydrocarbons (RH) in the pores, the curve will record a high resistivity. This resistivity is normally equal to or
slightly more than the deep induction curve (ILD). But. in an annulus situation, the medium curve (ILM) may
record a resistivity slightly less than the deep induction (ILD) curve.
Log Curve SFL—Spherically Focused Log® resistivity curves measure the resistivity of the flushed zone (R,,). Ina
hydrocarbon-bearing zone. the curve will read a higher resistivity than the deep (ILD) or inedium (ILM) induction
curves because the flushed zone (R,,) contains mud filtrate and residual hydrocarbons. The SFL* pictured here
records a greater resistivity than either the deep (LD) or medium (ILM) induction curves.