
Page 34 - Basic Well Log Analysis for Geologist
P. 34
BASIC RELATIONSHIPS OF WELL LOG INTERPRETATION
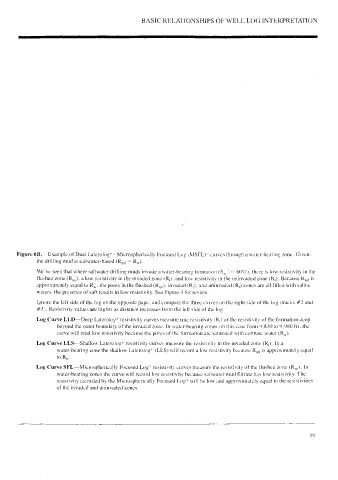
Figure 6B. Example of Dual Laterolog* - Microspherically Focused Log (MSFL)* curves through a water-bearing zone. Given:
the drilling mud is saltwater-based (Ryjp = Ry).
We've seen that where saltwater drilling muds invade a water-bearing formation (S,, ==> 60%), there is low resistivity in the
flushed zone (R,,). a low resistivity in the invaded zone (R;). and low resistivity in the uninvaded zone (R,). Because Ryyg is
approximately equal to R,,. the pores in the flushed (R,,). invaded (Rj), and uninvaded (R,) zones are all filled with saline
waters: the presence of salt results in low resistivity. See Figure 4 for review.
Ignore the left side of the log on the opposite page, and compare the three curves on the right side of the log (tracks #2 and
#3). Resistivity values are higher as distance increases from the left side of the log.
Log Curve LLD—Deep Laterolog* resistivity curves measure true resistivity (R,) or the resistivity of the formation deep
beyond the outer boundary of the invaded zone. In water-bearing zones (in this case from 9,830 to 9,980 ft), the
curve wil] read low resistivity because the pores of the formation are saturated with connate water (Ry).
Log Curve LLS—Shallow Laterolog* resistivity curves measure the resistivity in the invaded zone (Rj). Ina
water-bearing zone the shallow Laterolog* (LLS) will record a low resistivity because Rj, is approximately equal
to R,.
Log Curve SFL—Microspherically Focused Log* resistivity curves measure the resistivity of the flushed zone (R,,). In
water-bearing zones the curve will record low resistivity because saltwater mud filtrate has low resistivity. The
resistivity recorded by the Microspherically Focused Log* will be low and approximately equal to the resistivities
of the invaded and uninvaded zones.