
Page 32 - Basic Well Log Analysis for Geologist
P. 32
BASIC RELATIONSHIPS OF WELL LOG INTERPRETATION
ee eee eee esc eeneneeecene enna
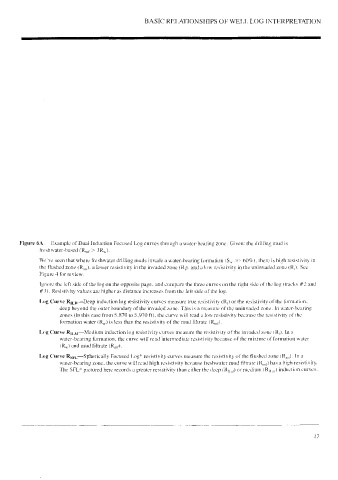
Figure 6A. Example of Dual Induction Focused Log curves through a water-bearing zone. Given: the drilling mud is
freshwater-based (Ry > 3Ry)-
We've seen that where freshwater drilling muds invade a water-bearing formation (S, => 60%), there is high resistivity in
the flushed zone (R,,). a lesser resistivity in the invaded zone (R;). and a low resistivity in the uninvaded zone (R,). See
Figure 4 for review.
Ignore the left side of the log on the opposite page. and compare the three curves on the right side of the log (tracks #2 and
#3). Resistivity values are higher as distance increases from the left side of the log.
Log Curve Ry p—Deep induction log resistivity curves measure true resistivity (R,) or the resistivity of the formation,
deep beyond the outer boundary of the invaded zone. This is a measure of the uninvaded zone. In water-bearing
zones (in this case from 5,870 to 5,970 ft), the curve will read a low resistivity because the resistivity of the
formation water (R,,) is less than the resistivity of the mud filtrate (Ryjp)-
Log Curve Ry y—Medium induction log resistivity curves measure the resistivity of the invaded zone (Rj). Ina
water-bearing formation, the curve will read intermediate resistivity because of the mixture of formation water
(R,,) and mud filtrate (Rypp)-
Log Curve Rgpy—Spherically Focused Log* resistivity curves measure the resistivity of the flushed zone (R,,). Ina
water-bearing zone, the curve will read high resistivity because freshwater mud filtrate (Ry) has a high resistivity.
The SFL* pictured here records a greater resistivity than cither the deep (Ry_qg) or medium (Ry ,,} Induction curves,