
Page 68 - Basic Well Log Analysis for Geologist
P. 68
HR
8 RNR re bn
RESISTIVITY LOGS
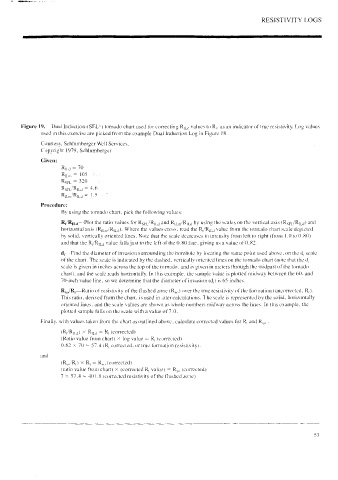
Figure 19, Dual Induction-(SFL*) tornado chart used for correcting Ry_g values to R,. as an indicator of true resistivity. Log values
used in this exercise are picked from the example Dual Induction Log in Figure 18.
Courtesy, Schlumberger Well Services.
Copyright 1979, Schlumberger
Given:
Riva = 70
Rpm = 105
Rep, = 320
Rog /Rirg = 46
Riw/Rig = 1-5 1%
Procedure:
By using the tornado chart, pick the following values:
R,/Ry_a—Plot the ratio values for Rgpp/Ry_g and Ry m/Rny by using the scales on the vertical axis (Rep /Ry_q) and
horizontal axis (Rypy/Rypg). Where the values cross. read the R,/Ryy value from the tornado chart scale depicted
by solid. vertically oriented lines. Note that the scale decreases in intensity from left to right (from 1.0 to 0.80)
and that the R/Ryyg value falls just to the left of the 0.80 line. giving us a value of 0.82.
d;—Find the diameter of invasion surrounding the borehole by locating the same point used above, on the d; scale
of the chart. The scale is indicated by the dashed, vertically oriented lines on the tornado chart (note that the d;
scale is given in inches across the top of the tornado, and is given in meters through the midpart of the tornado
chart), and the scale reads horzontally. In this example, the sample value is plotted midway between the 60- and
70-inch value line, so we determine that the diameter of invasion (d;) is 65 inches.
Ryo/R,—Ratio of resistivity of the flushed zone (R,,,) over the true resistivity of the formation (uncorrected, R,).
This ratio. derived from the chart, is used in later calculations. The scale is represented by the solid. horizontally
oriented lines, and the scale values are shown as whole numbers midway across the lines. In this example, the
plotted sample falls on the scale with a value of 7.0.
Finally, with values taken from the chart as outlined above, calculate corrected values for R, and Ry, -
(R/Ryg) * Ripy = R, (corrected)
(Ratio value from chart) X log value = R, (corrected)
0.82 x 70 = 57.4 (R, corrected, or true formation resistivity).
and
(Ryo/R,) X Ry = Ryo (corrected)
(ratio value froni chart) X (corrected R, value) = R,,, (corrected)
7X 57.4 = 401.8 (corrected resistivity of the flushed zone)
Nn Qo