
Page 64 - Basic Well Log Analysis for Geologist
P. 64
= IRR renin qin ie 00
RESISTIVITY LOGS
ee ee eee eee eee ce cence cee
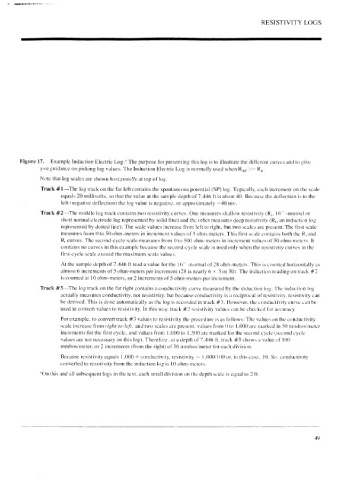
Figure 17. Example Induction Electric Log.* The purpose for presenting this log is to illustrate the different curves and to give
you guidance on picking log values. The Induction Electric Log is normally used when R,,p >> Ry.
Note that log scales are shown horizontally at top of log.
Track #1—The log track on the far Jeft contains the spontaneous potential (SP) log. Typically, each inerement on the scale
equals 20 millivolts, so that the value at the sample depth of 7,446 ft is about 40. Because the deflection is to the
left (negative deflection) the log value is negative, or approximately —40 mv.
Track #2—The middle log track contains two resistivity curves. One measures shallow resistivity (R;, 16°’ -normal or
short normal electrode log represented by solid line) and the other measures deep resistivity (R;, an induction log
represented by dotted line). The scale values increase from left to right, but two scales are present: The first scale
measures from 0 to 50 ohm-meters in increment values of 5 ohm-meters. This first seale contains both the R; and
R, curves. The second-cycle scale measures from 0 to 500 ohm-meters in increment values of SO ohm-meters. It
contains no curves in this example because the second-cycle scale is used only when the resistivity curves in the
first-cycle scale exceed the maximum scale values.
At the sample depth of 7,446 ft read a value for the 16'’ -normal of 28 ohm-meters. This is counted horizontally as
almost 6 increments of 5 ohm-meters per increment (28 is nearly 6 x 5 or 30). The induction reading on track #2
is counted at 10 ohm-meters, or 2 increments of 5 ohm-meters per increment.
Track #3—The log track on the far right contains a conductivity curve measured by the induction log. The induction log
actually measures conductivity, not resistivity, but because conductivity is a reciprocal of resistivity, resistivity can
be derived. This is done automatically as the log is recorded in track #3. However, the conductivity curve can be
used to convert values to resistivity. In this way. track #2 resistivity values can be checked for accuracy.
For example, to convert track #3 values to resistivity the procedure is as follows: The values on the conductivity
scale increase from right-to-left, and two scales are present: values from 0 to 1,000 are marked in 50 mmhos/meter
increments for the first cycle, and values from | ,000 to 1.500 are marked for the second cycle (second cycle
values are not necessary on this log). Therefore, at a depth of 7,446 ft. track #3 shows a value of 100
mmhos/meter, or 2 increments (from the right) of 50 mmhos/meter for each division.
Because resistivity equals | 000 + conductivity, resistivity = 1 000/100 or, in this case, 10. So, conductivity
converted to resistivity from the induction log is [0 ohm-meters.
*On this and al] subsequent logs in the text, each small division on the depth scale is equal to 2 ft.
49