
Page 74 - Basic Well Log Analysis for Geologist
P. 74
RESISTIVITY LOGS
a
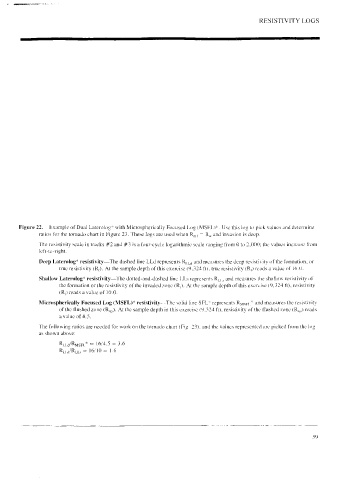
Figure 22... Example of Dual Laterolog* with Microspherically Focused Log (MSFL}*. Use this log to pick values and determine
ralios for the tornado chart in Figure 23. These logs are used when R,y; = Ry, and invasion is deep.
The resistivity scale in tracks #2 and #3 ts a four-cycle logarithmic scale ranging from 0 to 2.000; the values increase from
left-to-right.
Deep Laterolog* resistivity—The dashed line LLd represents Ry, 4 and measures the deep resistivity of the formation, or
true resistivity (R,). At the sample depth of this exercise (9,324 ft), true resistivity (R,) reads a value of 16.0.
Shallow Laterolog* resistivity—The dotted-and-dashed line LLs represents R;;, and measures the shallow resistivity of
the formation or the resistivity of the invaded zone (Rj). At the sample depth of this exercise (9.324 ft), resistivity
(Rj) reads a value of 10.0.
Microspherically Focused Log (MSFL)* resistivity——The solid line SFL* represents Ryspy.* and measures the resistivity
of the flushed zone (R,,). At the sample depth in this exercise (9,324 ft), resistivity of the flushed zone (R,,) reads
a value of 4.5.
The following ratios are needed for work on the tornado chart (Fig. 23). and the values represented are picked from the log
as shown above:
Ry pa/Rusei* = 16/4.5 = 3.6
Riud/Ris = 16/10 = 1.6