
Page 76 - Basic Well Log Analysis for Geologist
P. 76
ENE eR on
RESISTIVITY LOGS
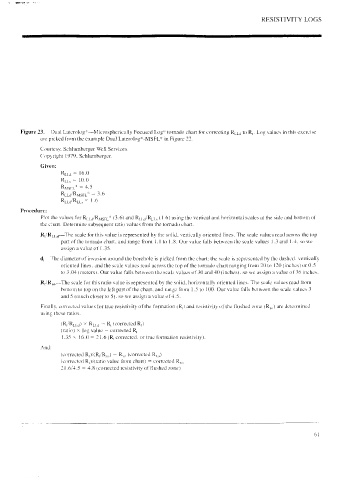
Figure 23. Dual Laterolog*—Microspherically Focused Log* tornado chart for correcting Rpyg to Ry. Log values in this exercise
are picked from the example Dual Laterolog*-MSFL* tn Figure 22.
Courtesy. Schlumberger Well Services.
Copyright 1979, Schlumberger.
Given:
Reta = 16.0
Rit, = 10.0
Rusri* = 4.5
Ripa/Ruseu* = 3.6
Riig/Rir, = 1.6
Procedure:
Plot the values for Rppg/Ruise.* (3.6) and Rypy/Rypy (1.6) using the vertical and horizontal seales at the side and bottom of
the chart. Determine subsequent ratio values from the tornado chart.
RY Rupa—the scale for this value is represented by the solid, vertically oriented lines. The scale values read across the top
part of the tornado chart, and range from 1.1 to 1.8. Our value falls between the scale values 1.3 and 1.4. so we
assign a value of 1.35.
dj—The diameter of invasion around the borehole is picked from the chart; the seale is represented by the dashed. vertically
oriented lines, and the scale values read across the top of the tornado chart ranging from 20 to 120 Cinches) or 0.5
to 3.04 (meters). Our value falls between the scale values of 30 and 40 (inches), so we assign a value of 36 inches.
R,/R,,—The scale for this ratio value is represented by the solid, horizontally oriented lines. The scale values read from
bottom to top on the left part of the chart, and range from 1.5 to 100. Our value falls between the scale values 3
and 5 (much closer to 5). so we assign a value of 4.5.
Finally. correeted values for truc resistivity of the formation (R,) and resistivity of the flushed zone (Rx,) are determined
using these ratios.
(R/Rypa) * Rug = R, (corrected R,)
(ratio) X log value = corrected R,
1.35 k 16.0 = 21.6 (R, corrected, or true formation resistivity).
And:
(corrected R,)/(R,/ Ryo) = Ryo (corrected R,,)
(corrected R,)/(ratio value trom chart) = corrected Ry,
21.6/4.5 = 4.8 (corrected resistivity of flushed zone)
61