
Page 120 - Basics of MATLAB and Beyond
P. 120
display and the enclosed area is the Figure object; that is, the window on
the screen in which the graphics are displayed. Many Figure objects can
exist at the same time, and the Figure’s handle is the number shown in
the window’s title bar (usually it is an integer, 1, 2,... ). Above Figure
objects in the hierarchy is the Root object, which is the entire com-
puter screen. Only one of these can exist, and its handle is the number
zero. In this Figure are four Axes objects (one is invisible): two are
three-dimensional and two are two-dimensional. The top left-hand Axes
2
object contains two Text objects (‘Focus’ and ‘y = x ’), and two Line
objects (the parabola and the single point marked by an ‘x’). These two
Line objects look different because they have different “LineStyle” and
“MarkerStyle” properties; more on this later.
31.1 Get and Set
The commands get and set are used to find out about the state of
graphics elements (get) and to change those elements’ properties (set).
For example, we will create a simple plot, and use get and set to change
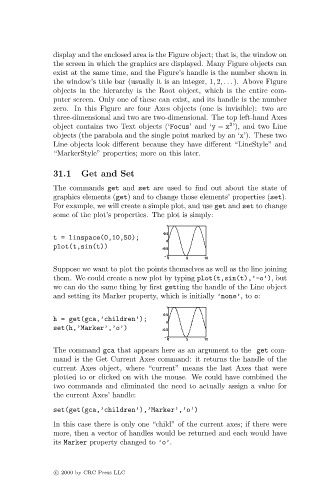
some of the plot’s properties. The plot is simply:
t = linspace(0,10,50);
plot(t,sin(t))
Suppose we want to plot the points themselves as well as the line joining
them. We could create a new plot by typing plot(t,sin(t),’-o’), but
we can do the same thing by first getting the handle of the Line object
and setting its Marker property, which is initially ’none’,to o:
h = get(gca,’children’);
set(h,’Marker’,’o’)
The command gca that appears here as an argument to the get com-
mand is the Get Current Axes command: it returns the handle of the
current Axes object, where “current” means the last Axes that were
plotted to or clicked on with the mouse. We could have combined the
two commands and eliminated the need to actually assign a value for
the current Axes’ handle:
set(get(gca,’children’),’Marker’,’o’)
In this case there is only one “child” of the current axes; if there were
more, then a vector of handles would be returned and each would have
its Marker property changed to ’o’.
c 2000 by CRC Press LLC