
Page 458 - Battery Reference Book
P. 458
Standard CP charging 4513
45.1 Stand,ard 3.0 I
45.1.1 Calcium-lead alloy lbatteries 2.8 i
This is the preferred method for charging calcium-lead 2.6
alloy grid low-maintenance batteries. By selecting i
an appropriate constant charging voltage and initial 2.4
charging current, the battery can be safely recharged
regardless of the depth of discharge in previous dis- 2.2 i
charge cycles. The recommended initial charging cur- 2.0
rents for calciurn-lead alloy low-maintenance batteries
are listed in Table 45.1. -
Q 1.8
I
t8
1.6
Table 46.1 Initial constant-potential charging currents for L
3
calcium-lead alloy iow-maintenance batteris a 1.4
e
Nominal capacit). Maximum initial charge current 6 1.2
(Ah) (A)
1 .o
~~
1.2 0.3
1.9 0.5 0.8
2.6 0.7
4.0 1.0 0.6
4.5 1.1
6.0 1.5 0.4
8.0 2.0
BQ.0 2.5 0.2
213.0 5.0
8 9 10
3
0 1 1 2 2 3 4 4 5 5 6 6 7 7 8 9 10
Time (hi
When carrying out constant-potential chargeddis-
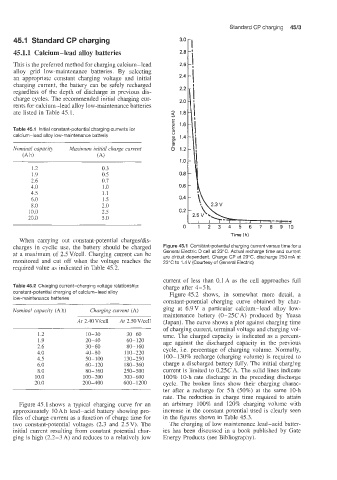
charges in cyclic use, the battery should be charged Figure 45.1 Constant-potential charging current versus time for a
at a maximum of 2.5Vkell. Charging current can be General Electric D cell at 23°C. Actual recharge time and current
are circuit dependent. Charge CP at 23"C, discharge 250mA at
monitored and cut off when the voltage reaches the 23°C to 1.4V (Courtesy of General Electric)
required value as indicated in Table 45.2.
current of less than 0.1 A as the cell approaches full
Table 45.2 Charging current-charging voltage relationship: charge after 4-5 h.
constant-potential charging of calcium-lead alloy Figure 45.2 shows, in somewhat more detail, a
low-maintenance batteries constant-potential charging curve obtained by char-
Nominal capaci5 (Ah) Charging current (A) ging at 6.9V a particular calcium-lead alloy low-
maintenance battery (0-25C A) produced by Yuasa
At 2.40 Vkell At 2.50 V/cell (Japan). The curve shows a plot against charging time
of charging current, terminal voltage and charging vol-
1.2 10-30 30-60 ume. The charged capacity is indicated as a perceni-
1.9 20-40 60-120 age against the discharged capacity in the previous
2.6 30-60 80-160 cycle, i.e. percentage of charging volume. Normally,
4.0 40-80 110-220
4.5 50-100 130-250 100-130% recharge (charging volume) is required to
6.0 60-120 180-360 charge a discharged battery fully. The initial charging
8.0 80-160 250-500 current is limited to 0.25CA. The solid lines indicate
10.0 100-200 300-600 100% 10-h rate discharge in the preceding discharge
20.0 200-400 600-1200 cycle. The broken lines show their charging charac-
ter after a recharge for 5 h (50%) at the same 10-h
rate. The reduction in charge time required to attain
Figure 45.1 shows a typical charging curve for an an arbitrary 100% and 120% charging volume with
approximately 10 Ah lead-acid battery showing pro- increase in the constant potential used is clearly seen
files of charge current as a function of charge time for in the figures shown in Table 45.3.
two constant-potential voltages (2.3 and 2.5 V). The The charging of low maintenance lead-acid batter-
initial current resulting from constant potential char- ies has been discussed in a book published by Gate
ging is high (2.2-3 A) and reduces to a relatively low Energy Products (see Bibliography).