
Page 134 - Becoming Metric Wise
P. 134
125
Publication and Citation Analysis
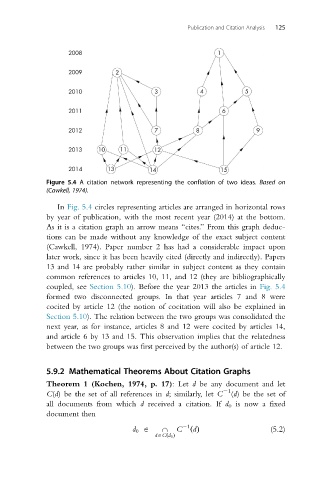
Figure 5.4 A citation network representing the conflation of two ideas. Based on
(Cawkell, 1974).
In Fig. 5.4 circles representing articles are arranged in horizontal rows
by year of publication, with the most recent year (2014) at the bottom.
As it is a citation graph an arrow means “cites.” From this graph deduc-
tions can be made without any knowledge of the exact subject content
(Cawkell, 1974). Paper number 2 has had a considerable impact upon
later work, since it has been heavily cited (directly and indirectly). Papers
13 and 14 are probably rather similar in subject content as they contain
common references to articles 10, 11, and 12 (they are bibliographically
coupled, see Section 5.10). Before the year 2013 the articles in Fig. 5.4
formed two disconnected groups. In that year articles 7 and 8 were
cocited by article 12 (the notion of cocitation will also be explained in
Section 5.10). The relation between the two groups was consolidated the
next year, as for instance, articles 8 and 12 were cocited by articles 14,
and article 6 by 13 and 15. This observation implies that the relatedness
between the two groups was first perceived by the author(s) of article 12.
5.9.2 Mathematical Theorems About Citation Graphs
Theorem 1 (Kochen, 1974, p. 17): Let d be any document and let
21
C(d) be the set of all references in d; similarly, let C (d) be the set of
all documents from which d received a citation. If d 0 is now a fixed
document then
21
d 0 A - C ðdÞ (5.2)
dACðd 0 Þ