
Page 78 - Becoming Metric Wise
P. 78
69
Statistics
Figure 4.1 Bar diagram.
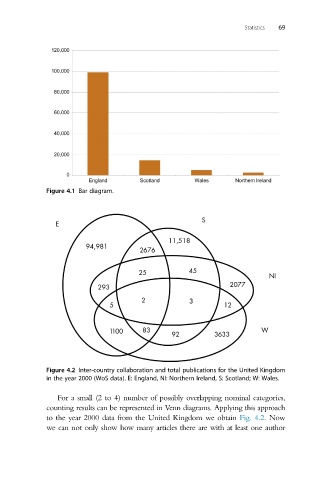
Figure 4.2 Inter-country collaboration and total publications for the United Kingdom
in the year 2000 (WoS data). E: England, NI: Northern Ireland, S: Scotland; W: Wales.
For a small (2 to 4) number of possibly overlapping nominal categories,
counting results can be represented in Venn diagrams. Applying this approach
to the year 2000 data from the United Kingdom we obtain Fig. 4.2.Now
we can not only show how many articles there are with at least one author