
Page 83 - Becoming Metric Wise
P. 83
73
Statistics
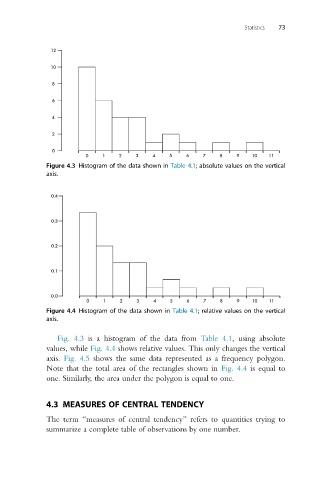
Figure 4.3 Histogram of the data shown in Table 4.1; absolute values on the vertical
axis.
Figure 4.4 Histogram of the data shown in Table 4.1; relative values on the vertical
axis.
Fig. 4.3 is a histogram of the data from Table 4.1, using absolute
values, while Fig. 4.4 shows relative values. This only changes the vertical
axis. Fig. 4.5 shows the same data represented as a frequency polygon.
Note that the total area of the rectangles shown in Fig. 4.4 is equal to
one. Similarly, the area under the polygon is equal to one.
4.3 MEASURES OF CENTRAL TENDENCY
The term “measures of central tendency” refers to quantities trying to
summarize a complete table of observations by one number.