
Page 116 - Biaxial Multiaxial Fatigue and Fracture
P. 116
Multiaxial Fatigue Life Estimations for 6082-T6 Cylindrical Specimens Under ... 101
of survival) were determined by using the p=l and p=O series (Tables 2 and 3) and under the
hypothesis of a log-normal distribution of the number of cycles for each stress level and for the
95% confidence level. By using the measured applied stresses and the actual out-of-phase angles,
all the experimental data reported in Tables 2-5 were re-analysed in terms of shear stress
amplitude and maximum stress normal to the initiation plane, defined as the plane that experienced
the maximum shear stress amplitude.
Assuming a linear expression for the tA,Ref (p) and k, (p) functions and using the bending (p=l)
and torsional (p=O) fatigue curves for the model calibrations, Eqs. (3) and (4) can be rewritten as:
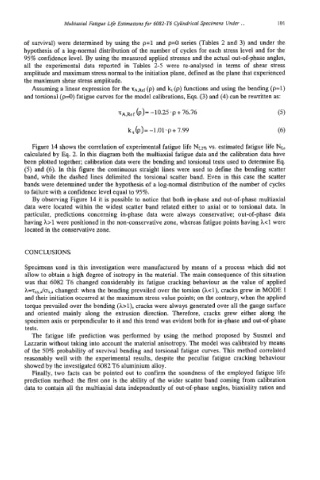
Figure 14 shows the correlation of experimental fatigue life Nc2% vs. estimated fatigue life Nf,,
calculated by Eq. 2. In this diagram both the multiaxial fatigue data and the calibration data have
been plotted together; calibration data were the bending and torsional tests used to determine Eq.
(5) and (6). In this figure the continuous straight lines were used to define the bending scatter
band, while the dashed lines delimited the torsional scatter band. Even in this case the scatter
bands were determined under the hypothesis of a log-normal distribution of the number of cycles
to failure with a confidence level equal to 95%.
By observing Figure 14 it is possible to notice that both in-phase and out-of-phase multiaxial
data were located within the widest scatter band related either to axial or to torsional data. In
particular, predictions concerning in-phase data were always conservative; out-of-phase data
having h>l were positioned in the non-conservative zone, whereas fatigue points having he1 were
located in the conservative zone.
CONCLUSIONS
Specimens used in this investigation were manufactured by means of a process which did not
allow to obtain a high degree of isotropy in the material. The main consequence of this situation
was that 6082 T6 changed considerably its fatigue cracking behaviour as the value of applied
h-~,~,&,~ changed: when the bending prevailed over the torsion (hel), cracks grew in MODE I
and their initiation occurred at the maximum stress value points; on the contrary, when the applied
torque prevailed over the bending (bl), cracks were always generated over all the gauge surface
and oriented mainly along the extrusion direction. Therefore, cracks grew either along the
specimen axis or perpendicular to it and this trend was evident both for in-phase and out-of-phase
tests.
The fatigue life prediction was performed by using the method proposed by Susmel and
Lazzarin without taking into account the material anisotropy. The model was calibrated by means
of the 50% probability of survival bending and torsional fatigue curves. This method correlated
reasonably well with the experimental results, despite the peculiar fatigue cracking behaviour
showed by the investigated 6082 T6 aluminium alloy.
Finally, two facts can be pointed out to confirm the soundness of the employed fatigue life
prediction method the first one is the ability of the wider scatter band coming from calibration
data to contain all the multiaxial data independently of out-of-phase angles, biaxiality ratios and