
Page 143 - Biaxial Multiaxial Fatigue and Fracture
P. 143
128 R.P KAUFMAN AND TH. TOPPER
Fig. 3. Biaxial fatigue system [28].
Specimen Design
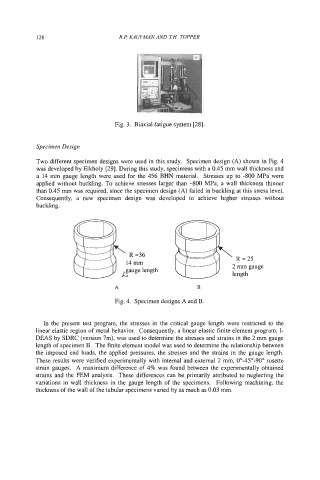
Two different specimen designs were used in this study. Specimen design (A) shown in Fig. 4
was developed by Elkholy [29]. During this study, specimens with a 0.45 mm wall thickness and
a 14 mm gauge length were used for the 456 BHN material. Stresses up to -800 MPa were
applied without buckling. To achieve stresses larger than -800 MPa, a wall thickness thinner
than 0.45 mm was required, since the specimen design (A) failed in buckling at this stress level.
Consequently, a new specimen design was developed to achieve higher stresses without
buckling.
R=25
2 mm gauge
length
A B
Fig. 4. Specimen designs A and B.
In the present test program, the stresses in the critical gauge length were restricted to the
linear elastic region of metal behavior. Consequently, a linear elastic finite element program, I-
DEAS by SDRC (version 7m), was used to determine the stresses and strains in the 2 mm gauge
length of specimen B. The finite element model was used to determine the relationship between
the imposed end loads, the applied pressures, the stresses and the strains in the gauge length.
These results were verified experimentally with internal and external 2 mm, 0"-45"-90" rosette
strain gauges. A maximum difference of 4% was found between the experimentally obtained
strains and the FEM analysis. These differences can be primarily attributed to neglecting the
variations in wall thickness in the gauge length of the specimens. Following machining, the
thickness of the wall of the tubular specimens varied by as much as 0.03 mm.