
Page 292 - Biaxial Multiaxial Fatigue and Fracture
P. 292
276 A. BUCZYNSKI AND G. GLINKA
stress increment. The slope of the current linear segment of the stress-strain curve defines the
plastic modulus, AcreqlA€e:, necessary for the determination of the parameter, dh, in the
constitutive equation (IO). The plasticity models are described in most publications, as
algorithms for calculating strain increments that result from given series of stress increments or
vice versa. This is called as the stress or strain controlled input. In the case of the notch analysis
neither stresses nor strains are directly inputted into the plasticity model. The input is given in
the form of the total deviatoric strain energy density increments and both the deviatoric strain
and stress increments are to be found simultaneously by solving the equation set (12). Therefore,
the plasticity model is needed only to indicate which work-hardening surface is to be active
during current load increment, which subsequently determines the instantaneous value of the
parameter dh. In order to find the actual elastic-plastic deviatoric stress and strain increment ASit
and Aega from the equation set (12), the value of parameter dh is determined first according to
the current configuration of plasticity surfaces. After calculating all stress increments, Asit, and
subsequently, AGi?, the plasticity surfaces are translated as shown in Fig. 6. The process is
repeated for each subsequent increment of the “elastic” input, Ac;.
The Mroz [9] and Garud [ 101 models were chosen here as an illustration. Obviously, any other
plasticity model can be associated with the incremental stress-strain notch analysis proposed
above. The Garud plasticity model was employed in the analysis discussed below.
COMPARiSON OF CALCULATED ELASTIC-PLASTIC NOTCH TIP STRAINS AND
STRESSES WITH ELASTIC-PLASTIC FINITE ELEMENT DATA
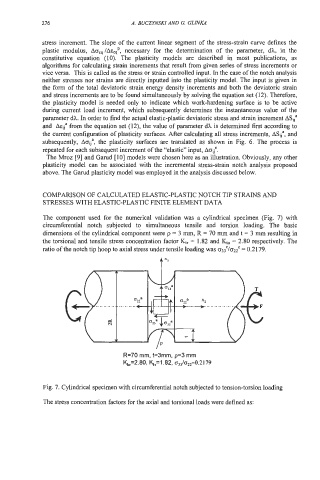
The component used for the numerical validation was a cylindrical specimen (Fig. 7) with
circumferential notch subjected to simultaneous tensile and torsion loading. The basic
dimensions of the cylindrical component were p = 3 mm, R = 70 mm and t = 3 mm resulting in
the torsional and tensile stress concentration factor K,, = 1.82 and Kt, = 2.80 respectively. The
ratio of the notch tip hoop to axial stress under tensile loading was ~33%22~ = 0.2179.
f x3
R=70 rnrn, t=3mrn. p=3 rnrn
b0=2.80, bT=1 .82, a,,/0,~=0.2179
Fig. 7. Cylindrical specimen with circumferential notch subjected to tension-torsion loading
The stress concentration factors for the axial and torsional loads were defined as: