
Page 194 - Bio Engineering Approaches to Cancer Diagnosis and Treatment
P. 194
8.2 Approved modes for ultrasound therapy 193
a mathematical model of secondary effects, such as acoustic force and acoustic
power, expansion of the equations to second-order perturbation (nonlinear effect) are
required. Passing sound rays on tissue and blood can lead to temperature changes,
vibration, and bubble formation. These three major physical factors will continue to
be addressed.
8.2.3.1 Temperature rise in the tissue and biofluids
The released ultrasonic waves in a medium are passed, reflected, or absorbed. When
the sound waves are absorbed the temperature rises because of the conversion of
mechanical energy to heat. For best performance, body temperature should stay at
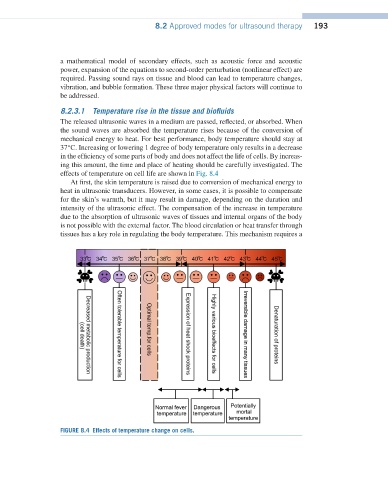
37°C. Increasing or lowering 1 degree of body temperature only results in a decrease
in the efficiency of some parts of body and does not affect the life of cells. By increas-
ing this amount, the time and place of heating should be carefully investigated. The
effects of temperature on cell life are shown in Fig. 8.4
At first, the skin temperature is raised due to conversion of mechanical energy to
heat in ultrasonic transducers. However, in some cases, it is possible to compensate
for the skin’s warmth, but it may result in damage, depending on the duration and
intensity of the ultrasonic effect. The compensation of the increase in temperature
due to the absorption of ultrasonic waves of tissues and internal organs of the body
is not possible with the external factor. The blood circulation or heat transfer through
tissues has a key role in regulating the body temperature. This mechanism requires a
FIGURE 8.4 Effects of temperature change on cells.